Talk about performance — and about how to make website content load faster — has increasingly been centered around optimizing web experiences leading to higher end-user engagement. More specifically, around metrics leading to website speed, greater conversions and ROI.
Seeing what slows down your website and taking action will lead to better results overall. But that’s easier said than done considering the amount of content taking up page real estate these days is largely being dominated by video, images, CSS, and JavaScript — all of which when unoptimized can drag down website speeds to a virtual crawl and ding your SEO metrics.
Ever since Google started using page speed data as a ranking signal for desktop and mobile searches, developers have looking for ways to gain better transparency via a good visual representations of exactly what is happening while a page is loading all of its elements simultaneously — and which of those elements is negatively affecting website speed the most.
To this end, Uptrends offers several new performance-related features engineered to help improve website speed by offering visual snapshots of how desktop or mobile users experience your webpage. Here’s what’s new.
Free Website Speed test
Uptrends’ Free Website Speed test offers a powerful trio of tools designed to take the guesswork out of website speed optimization starting with providing critical metrics, such as Core Web Vitals, W3C navigation timing, and the timeline of screenshots (filmstrip).
We spin up your site in the 3 major browsers from over 225 global checkpoints, analyzing everything from the quantity and size of your page elements, the allocation of images, script files, CSS files, HTML files, and the domains the elements come from. Key metrics include:
Filmstrip
The ability to visualize a series of screenshots, from the browser, showing exactly what the page looked like at different points during its loading process is like finding monitoring gold.
That’s because with so many elements loading in the browser simultaneously, it can often be difficult to form an image of what is actually happening in the browser during specific points in time. Timeline screenshots, also called a filmstrip, provides the kind of clarity you see exactly where images are failing to load or if faulty scripts are bogging down the rest of the page.
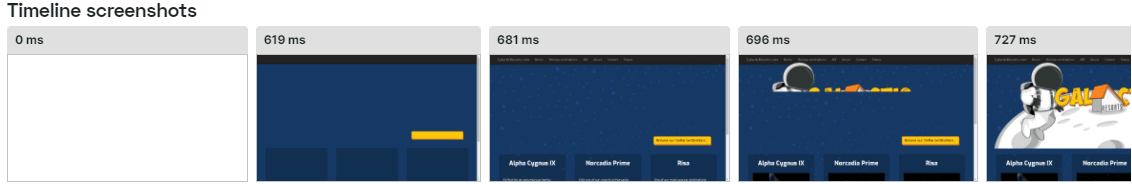
The timeline you see above was sourced directly from the Chrome browser. By default, Chrome collects screenshots in its Dev tolls interface, which we can then display the most relevant ones in our filmstrip:
- First/last screenshot
- First Contentful Paint,
- Largest Contentful Paint
- Time to interactive
Depending on the total time of the monitor, a minimum of 6 screenshots are presented in the filmstrip.
Waterfall chart
Waterfall charts are visual representations of how website resources are being used related to the loading of page elements. The timeline gives you the opportunity to see the sequence and dependencies between resources.
It assists in identifying where important events happened during the loading process. Waterfall charts also let the user easily see information about the request that was made to retrieve the element, and the following response, showing you exactly what is slowing down your site.
The waterfall chart displays URLs of each page elements in the first column, then the size of the page element and the loading time measurements taken during the monitor check for all page elements that were loaded.
The measurements are shown chronologically from left to right with one row for each page element, which are color coded.

Waterfall reports can be generated by default for users running Full Page Check monitors and will provide you with the following useful information:
- The request URL, method, and protocol used
- An overview of the request headers included in the request
- The IP address of the responding server
- Information about the (un)compressed size of the element:
- Network size: the actual number of bytes that were downloaded (compressed size)
- Resource size / uncompressed size: Size of the element after decompression, if applicable
- Any response headers that were included in the response
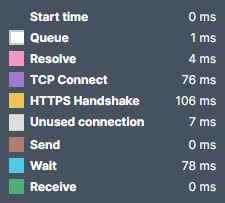
Below the waterfall chart, you will see detailed information about timing request based on type. Simply hover over the measurements for a specific element and a popup will provide you with further details.
You can also export waterfall charts in the form of a PDF file for reference later on or when making presentations to third parties. Click the Export to PDF button on the right above the chart to start generating a PDF copy of your waterfall chart and saving it.
Core Web Vitals
Core Web Vitals are a set of specific metrics that measure certain aspects of real-user experience on the web. In 2020, Google added three new page experience signals that make up CWV. More specifically, they are Largest Contentful Paint (LCP), First Input Delay (FID), and Cumulative Layout Shift (CLS).
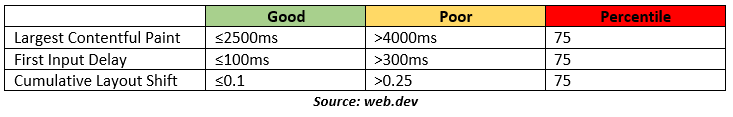
For example, a 75th percentile LCP of 2 seconds is classified as “good”, while a 75th percentile LCP of 5 seconds is classified as “poor”.
In addition to the metrics mentioned above, Uptrends Full Page Check monitors Time to interactive (TTI), an indication of the time between the start of loading, and when the page can reliably respond to user inputs and Total blocking time (TBT), the time between the First Contentful Paint and the Time to interactive. Together, these metrics provide important benchmarks for developers to extract quantifiable data as to whether their site is good, needs improvement, is poor.
Poor scores on such metrics may directly affect your search engine rankings, meaning it’s important to keep track of these key numbers, so you can ensure your page is and remains properly optimized.
W3C timing metrics
The World Wide Web Consortium (W3C) is the main international standards involved in developing standards for long-term growth of the world wide web. Its mandate is to define timing information regarding the loading of webpages.
Uptrends’ Website Speed test monitor type comes with the option to display a subset of W3C navigation timing metrics. For illustration, the following image shows all navigation timing events as defined by the W3C, on a timeline.
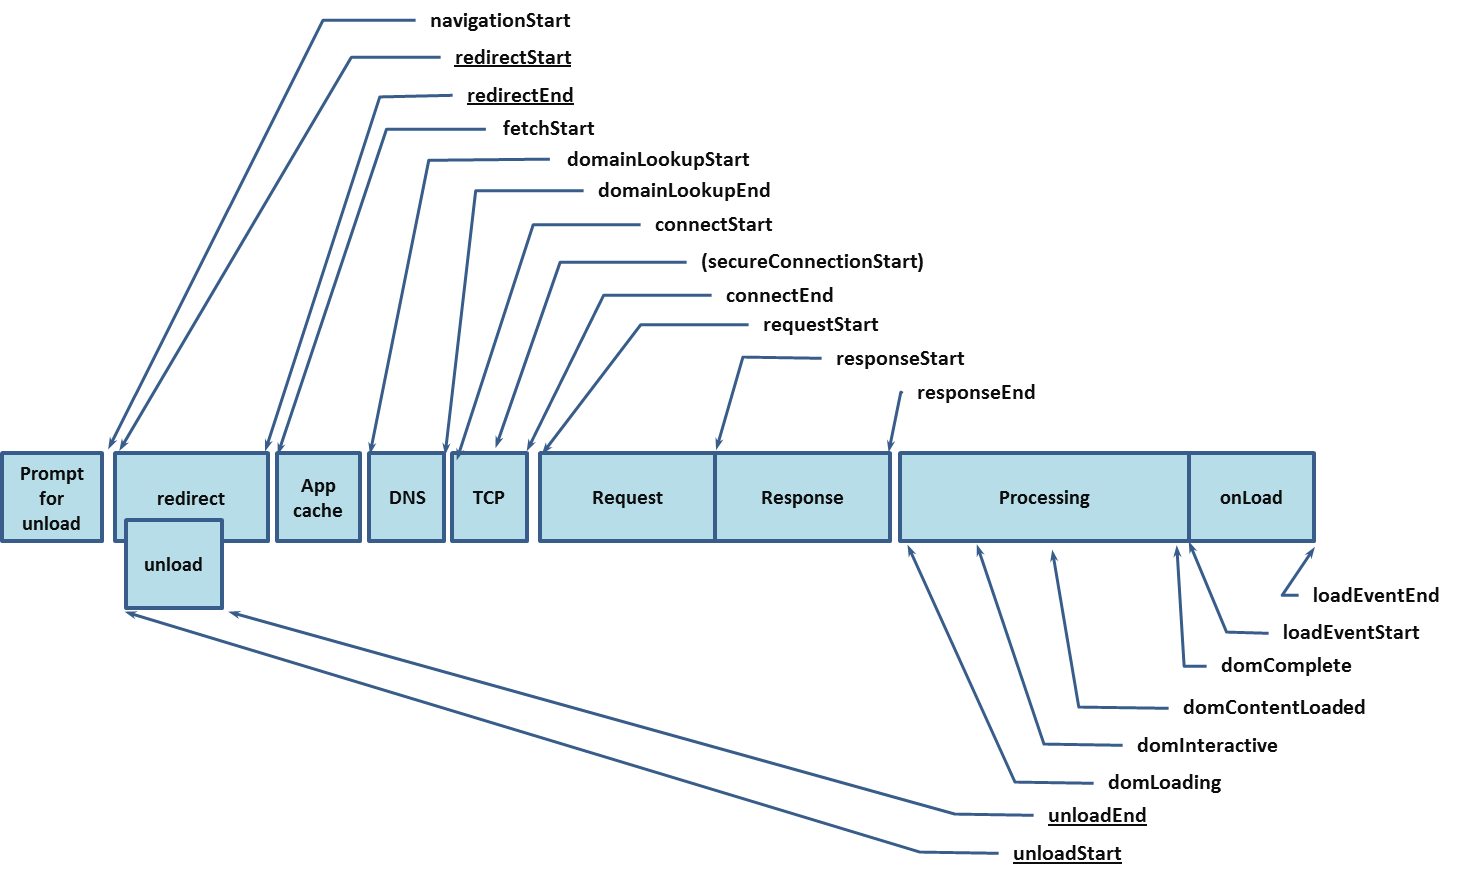
Source: World Wide Web Consortium
You can learn more about W3C Navigation Timing events, such as Request start, Time to first byte, DOM interactive and more by checking out Uptrends’ Library.
Takeaway
Poor scores on metrics, such as CWV, W3C may directly affect your search engine rankings, meaning it’s important to keep track of these key numbers, so you can ensure your page is and remains properly optimized. You’ll be in a better position to spot latency problems before your users let you know about them and inspect Google PageSpeed Insights scores.
Furthermore, slower mobile speed will not only lower your website ranking for Google keyword search results but will also reflect poorly with your customer base as more and more users turn to mobile devices to access your website.
Uptrends’ free Website Speed Test gives you a snapshot of how your desktop or mobile users experience your webpage from all three browsers. Get everything you need to make smart performance-related decisions right now about your website and its content.