
We did it again. We just published a new free tool, the HTTP Response Header Check. This handy little gadget quickly grabs your HTTP response headers for your review. It sounds simple because it is. But as every good DevOps pro knows, it is always a good idea to check your headers from time to time.
What is an HTTP response header?
For those who may not know, an HTTP response header is a text-based component attached to any response coming from the server. The response headers give the client information and instruction about the response body, security settings, cache recommendations, cookies, and responding server details.
Why look at my server’s response headers?
It’s a good idea to check your response headers from time to time. Checking your response headers is a bit like having your mechanic do a diagnostic on your car. You definitely want a diagnostic check done when you’ve got a problem, but you also want them to check out your car during routine maintenance to fix problems that haven’t left you stranded yet. Reviewing your response headers is a bit like a preventive maintenance check.
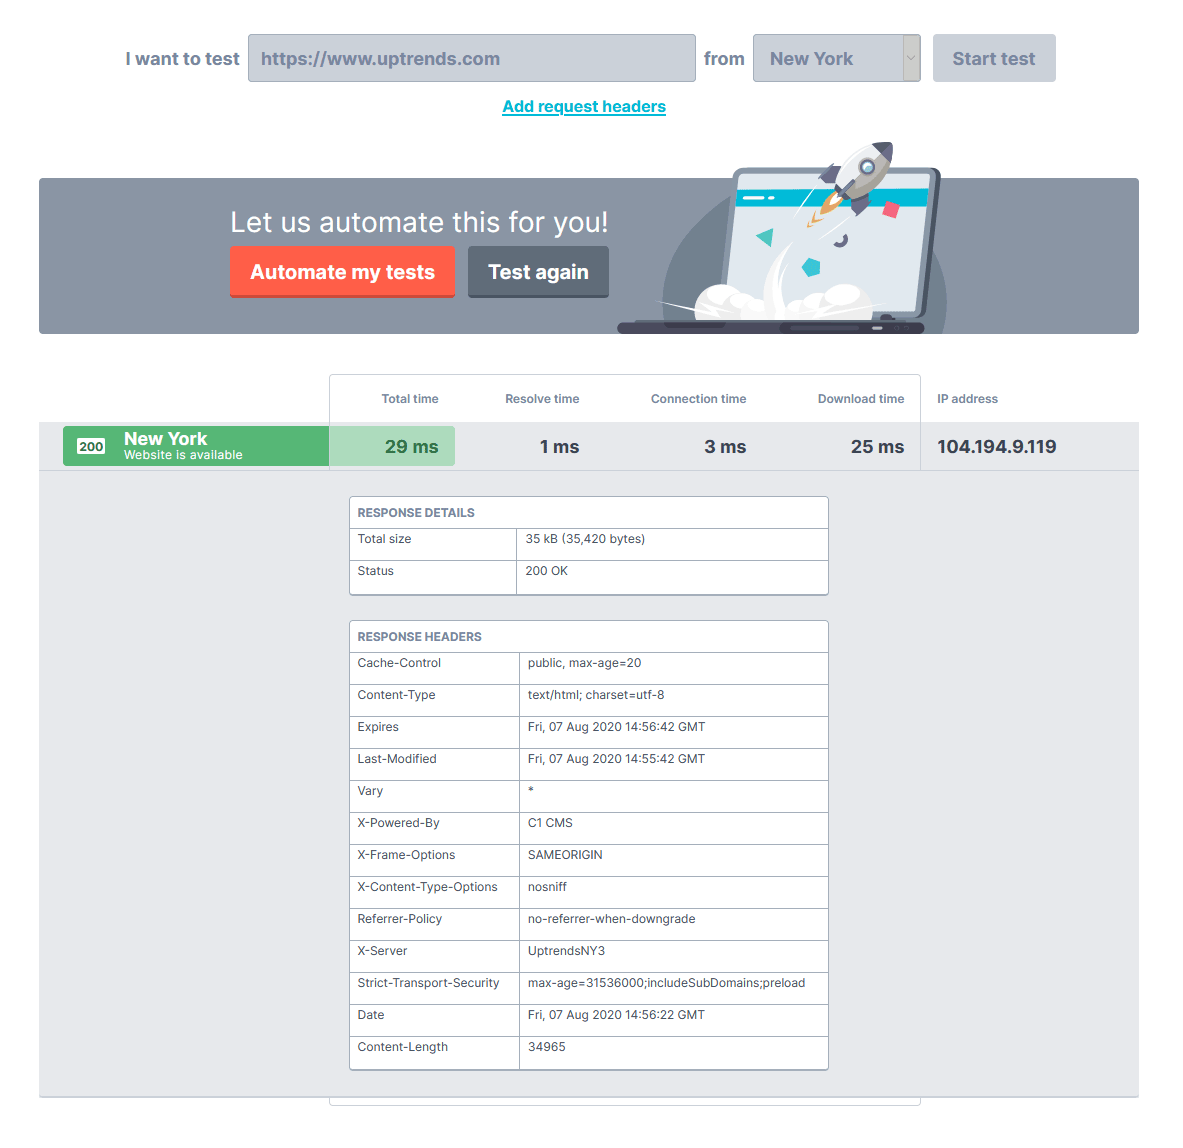
A periodic look at your response headers let you verify some of the details that affect your users’ experiences. Beyond the status code—hopefully, it is 200 ok—you get so much information depending on what headers your site supports. Let’s look at what you get when you use the HTTP Response Header Check tool.
Responding IP address
Your test includes the IP address of the responding server. Knowing from where the response originates is especially helpful when troubleshooting (see graphic below). If your site uses the x-server header with the name of the specific machine, you can really pinpoint issues.

Basic performance
Of course, the time it takes to receive the first response isn’t representative of total page load time, but it is a good indicator of the server’s health (See graphic above). You get
- Total time
- DNS resolve time
- Connection time
- Download time
If you want a detailed performance test, Uptrends’ free Website Speed Test gives you performance information on the entire page load progression using a real browser. You can also review the request and the response headers for each page element.
Response Headers
The response headers vary from site to site with standard and non-standard headers. To cover all the options here would be difficult, and well a bit boring. Wikipedia has a pretty good article about the various HTTP headers and their values. Below you can find some that we feel are important to review.
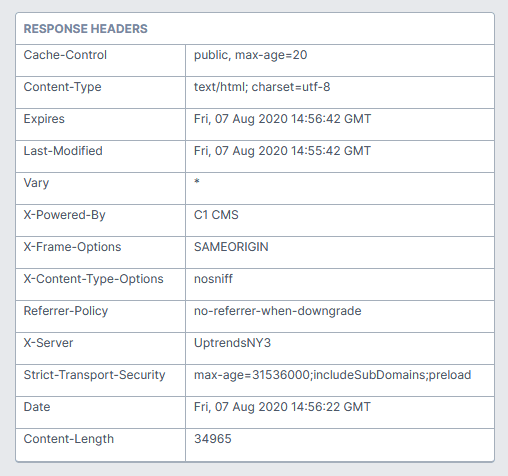
Content-Type
The Content-Type tells the browser what to expect. For example, in the figure above, the MIME (multipurpose Internet mail extensions) type text/html tells the browser that it is receiving an HTML text file. The MIME type text may also contain XML (text/xml), a simple text document (text/plain), or one of many other subtypes of type text. Other common MIME types include image, video, audio, and application.
Cache settings and compression
Your site’s cache and compression settings are extremely important to your overall page performance. Taking a quick peek at your Cache-Control and Content-Encoding headers and checking for the correct settings can help you catch some performance problems early. Or if your Web Performance Monitoring is telling you performance is slipping, the Response Header Check is a quick way to verify settings.
Cookies
Depending on your choices, cookies help you to personalize a visitor’s experience. Cookies may also give you information about a user’s activity on your site and manage session information. By reviewing your site’s Set-Cookie headers, you can verify that your users receive the correct cookies.
Security
Security is a big concern. You need to occasionally check your headers, such as Strict-Transport-Security, for correct settings, but there are other security-related headers you should also check. The wrong settings in some fields may leave your site vulnerable to attacks. For example, is the server properly encoding string values in the header fields to avoid HTTP response splitting attacks?
Another vulnerability is your X-Frame-Options response header. Make sure this has the correct values to prevent clickjacking by restricting the browser from certain actions.
denyprevents the browser from loading additional content in any frame.sameoriginonly allows the browser to place content in frames that come from the same domain.allow-fromallows the browser to permit content from a specified location.
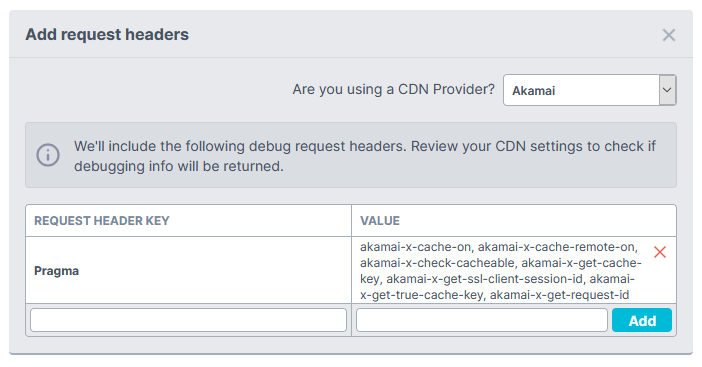
Add your own request headers
If you need to customize your request headers or you want to use the defaults for your CDN provider, click the Add request headers link. Setting the request headers is especially helpful if your CDN requires debug headers.
Conclusion
It’s a simple little tool that makes it super easy to review your response headers on the fly or while looking for the root cause of a site problem. The tool is free to use on our website and inside the Uptrends application under Apps & Extras.