
Software upgrades are typically about offering new upgrades and improvements that enhance the end user experience, offer greater efficiency, and provide a more feature-rich product. These are also some of the reasons why Uptrends has released a new version of the Full Page Check monitor, which offers lots of benefits over the previous version.
The demand for more metrics has grown over time not only for how the elements load but also how the page is presented to the end users. The Full Page Check (FPC) monitor type provides rich, detailed performance data about how your webpage functions on an element-by-element basis. Although FPC has been around for a few years, it was time to make upgrades.
For one, the newly improved FPC technology runs on the latest version of Google’s Chrome browser to load a page and track its page load time, including the behavior of all underlying page elements. It also conveys information about third-party elements, such as plugins for social media and advertising. Users of the upgraded FPC monitor type will notice that “Chrome with extra metrics” will now be the default setting.
In addition to changing and improving some of the existing functionality, a number of other new features were introduced. Take a look at what’s new.
How a FPC works
As mentioned above, the Full Page Check (FPC) monitor type provides detailed performance data about your web page on an element-by-element basis.
Much like a Real Browser Check (RBC), a FPC loads your page using an actual browser and downloads each element — scripts, CSS, third-party elements, images. However, there’s a distinct difference between an FPC and the RBC.
A FPC displays a rich waterfall chart to inspect those elements. The waterfall report separates out your page elements and reports the time taken for each of these steps. In addition, when you run a FPC, the waterfall is generated by default.
While the standard FPC monitor gives you information about your third-party elements, such as plugins for social media and advertising, selecting the enhanced FPC (Full Page Check +) allows the option for you to report on those elements. For more information about setting up the FPC or FPC+ monitor types, check out Uptrends Academy’s lesson on Website Performance Monitors.
New features
Native checks
The new FPC measures performance directly within the browser, and no longer needs a proxy to collect information. This allows the browser to function as close to natural as possible.
Core Web Vitals
Core Web Vitals are standard metrics originally introduced by Google https://web.dev/vitals to better understand the performance of your website and provide better insights into how the user experiences the page:
- When does the user see something on the page?
- How fast can the user click on an element to interact with the page?
- Is the page stable?
Users are increasingly looking for higher Google page rankings and we are supporting this endeavor with improved Core Web Vitals. Uptrends now measures and reports those metrics in the check results, especially now that Google uses them in overall page rankings.
In 2021, Google introduced the Core Web Vitals algorithm update that measures a website’s Core Web Vitals metrics. Pages score higher when the CWVs are good, which in turn is good for better SEO ranking. This point should not be overlooked, especially by those engaged in digital marketing.
It’s important to note that CWV measurements may be different than what is measured with Google’s Lighthouse tool. That’s because Lighthouse uses a different measuring technique than Uptrends, which runs a browser to visit a website just like a normal user would. Moreover, here’s why the Core Web Vitals reported by Lighthouse can differ from Uptrend’s measurements:
- The Lighthouse tool first runs a warmup then visits the site several times to determine an average.
- It doesn’t trigger certain user input checks that our measuring technique and normal users do.
- It also simulates a slower connection with throttling.
Stay tuned for upcoming developments as Uptrends will soon offer tools for users to monitor CWV metrics on a more granular level. Further details on Core Web Vitals in general are available for you to learn all about the new metrics in the meantime.
W3C metrics
The Word Wide Web Consortium (W3C) has defined a set of navigation timings that are essential to loading a web page. These were developed as a standard for browsers and web applications to display this information when a page loads.
The new FPC displays a subset of W3C navigation timing metrics, several of which can be measured and shown in reports. To find out more details about the implemented navigation timing API, you can read this article W3C navigation timings.
Timeline screenshots-filmstrip
The timeline of screenshots (filmstrip) are a totally new feature that are taken while the monitored webpage is loading. This new feature provides a visual timeline via filmstrip, which is presented above the waterfall in the monitor check details.
HTTP2, HTTP3, QUIC
In addition to the HTTP protocol, the FPC monitor now also supports the HTTP2, HTTP3 and QUIC protocol. About 97.2% of all users support HTTP2 and about 50% of all the websites worldwide support it as well. With HTTP2, pages load 5%-25% faster than HTTP 1.1, a significant change from the old protocol.
Although HTTP3 is still evolving, up to 73% of users and 23% of websites have adopted this protocol, which is especially good for below average connections.
Cached elements
Because we extract performance information from the browser, we can now also show cached elements that we couldn’t detect with our proxy-based measuring technology. It is possible to filter them if so desired.
Data URLs in waterfall
Elements that are embedded inside the HTML document, such as data URLs, or that come from JavaScript, such as Blob URLs, are also shown in the waterfall. You can apply a filter if needed.
TLS information
In the waterfall of the monitor check details you can now find TLS information for each element. You can open the details from the waterfall by clicking on the plus sign next to the element:
How to switch on the new features
If you want to use the new features for your FPC monitor(s), you have to actively switch this on for individual monitors. Keep in mind that this currently only works for Google Chrome browsers.
To switch on the new features:
- Open an existing monitor or create a new one.
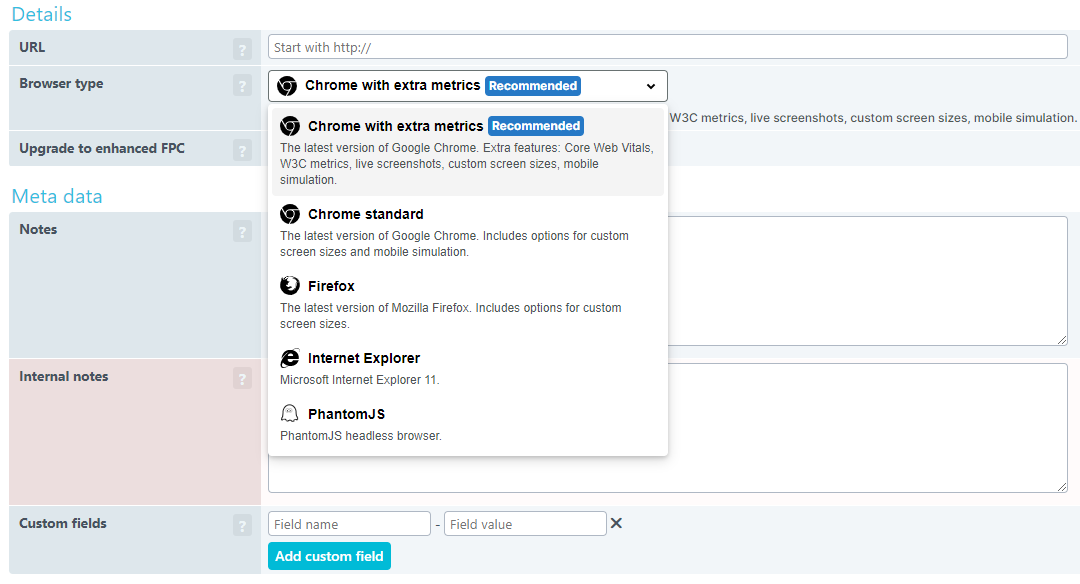
- Go to the Main tab.
- In the Details section choose the Browser type “Chrome with extra metrics”.
- Click Save.
Changed features
A number of existing features have changed that offer enhanced visibility into the FPC monitor type. That may mean different use or (slightly) different results. To get an idea of what to expect, check the list below for specific details.
Content match
The content matching works differently now. Previously, FPC content matching was done on all HTML content that was sent to the browser, including content on redirect pages. For the new FPC, only the final result is considered when matching content. Content shown during a redirect will no longer trigger a content match.
URL blocking
The URL blocking feature is also different in the new FPC. When navigating to a site, the navigation will succeed even if the URL of that site is listed in the blocked URLs list. That’s because the new FPC no longer blocks navigation. Other elements that the site references, such as images will be blocked as they were before.
New measuring techniques
The timings and total bytes are now different from measurements that are taken by the former FPC.
For example, the new FPC supports newer protocols, such as HTTP2 and HTTP3 and is more closely integrated with the browser. As a result, the waterfall generated can differ from that of an old FPC. You will likely see more simultaneous requests that transfer more quickly.
Because the measurement can be quicker or slower, the total bytes could also differ from the old FPC because we capture a different amount of background activity after the page load. For example, a video that is loading, or a JavaScript service worker that is performing background tasks.
W3C total time or Total time?
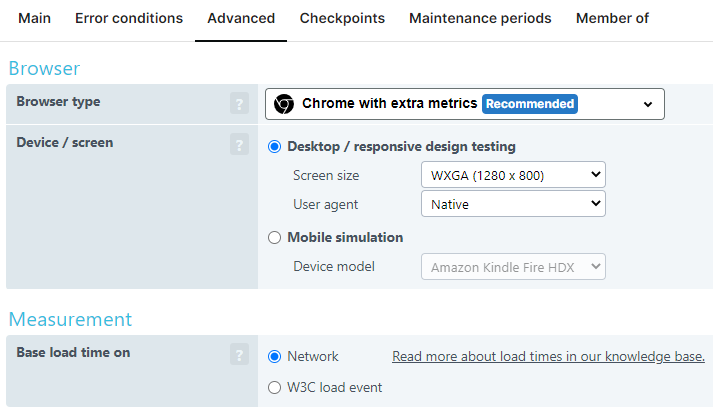
With the new FPC, we also provide the option to measure the total time as the W3C load event instead of our usual way of measuring total time by waiting for an idle period of network activity. You can read more about the technical details of the W3C load event on W3.org.
To make your choice, go to the Advanced tab of the monitor settings. In the Measurement section select one of the options within the Base load time on:
Headers
Requests done by new protocols, such as HTTP2, HTTP3 and QUIC will also have different headers. The new FPC will no longer use X-Uptrends headers, such as X-Uptrends-PortInfo and X-Blocked-By-Uptrends.
Takeaway
The newly upgraded FPC produces more accurate and realistic measurements via protocol support and direct measurements compared to the old FPC version, which used a proxy to capture network traffic. The result is a richer, more detailed window into the behavior of all underlying page elements.
Core Web Vitals are now measured and reported in the check results. Public-facing sites may benefit with regard to SEO now that Google places a higher emphasis on CWV metrics. Timeline screenshots provide a visual representation of the page load lifecycle in relation to CWV and W3C metrics.
The FPC monitor with upgraded features is currently available for all Uptrends accounts, including trials. Be sure to speak to your sales representative to find out more details.