Grafana is long known as a leading open source platform for those needing beautifully rich, composable operational dashboards. The notion of being able to connect disparate data sources to Grafana for improved monitoring of infrastructure, log analytics, and overall better operational efficiency is an increasingly alluring prospect for those in fintech, ecommerce, and other industrial sectors.
The dashboards contain lots of visualization options, such as geo maps, heat maps, histograms, and a variety of charts and graphs, which a business typically requires to make better sense of monitoring data and improve overall observability.
Now, the Uptrends Grafana integration allows you to pull data about status and statistics that are reported by Uptrends monitors and monitor groups so it can be displayed within a Grafana environment.
How it integrates with Uptrends’ monitoring tools
Grafana makes use of the Uptrends APIv4 to retrieve statistical data, or data about the current status, for your monitors and monitor groups.
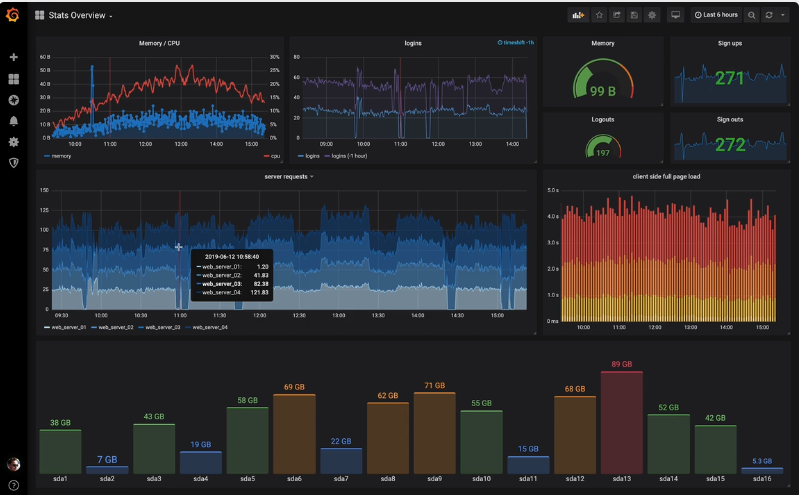
(Sample dashboard/ Grafana.com)
The setup requires the installation of an Uptrends plugin, which is available as a download file from the Uptrends website. Grafana must also have access to a registered APIv4 account. You can create an APIv4 account by following the instructions in the article on Authentication and creating an API account.
More information about displaying your monitoring data in Grafana can be found here.
Why use Grafana
In many large organizations, data sources are either scattered, siloed or overlapping without much of a view as to how systems are interrelated. A key benefit of Grafana is that it can be easily integrated with a wide range of different data sources, other officially supported sources, and 3rd-party plugins.
- Unify existing data, visualize in single dashboard
- Create, share dashboards with other team members
- Data everyone can see. Break down silos, empower teams
- Flexibility and versatility. Customize panels helpful to your organization
Going from silos to a single pane of glass helps your teams quickly identify root causes and the impact of costly incidents, which by some estimates can cost hundreds of thousands of dollars for each hour of downtime.
Grafana’s ease of use and visually rich dashboard setup gets lots of early adopters onboard with the platform but as mentioned earlier, it can also guide organizations toward better observability, especially when used with Uptrends Synthetic and Real User Monitoring.
Uptrends is here to guide your organization toward better monitoring capabilities supporting greater observability and greater efficiency via improved web performance, uptime, and faster MTTR.
Got more questions about setting up the new Grafana integration? Feel free to talk to any one of our knowledgeable support people or schedule a one-on-one demonstration to learn more about Grafana or Uptrends monitoring products at your convenience.