We’ve been busy, and we have revamped our popular, free Website Speed Test Tool making it even better with new features and more information. You get real insights into the performance of your website (or your competitors’). We’ve identified 18 things we know you’re going to love about Uptrends’ free Website Speed Test Tool, but we are pretty sure you will find even more things to love when you see it in action.
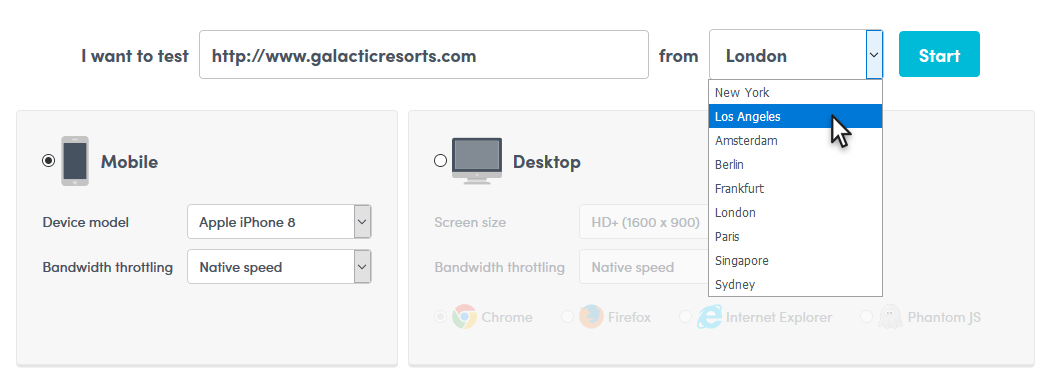
1. Test your website speed from nine worldwide locations
It isn’t the 184 test locations you get with our subscription service, but the nine locations do cover four continents giving you plenty of options for testing your speed and identifying localized issues such as latency.
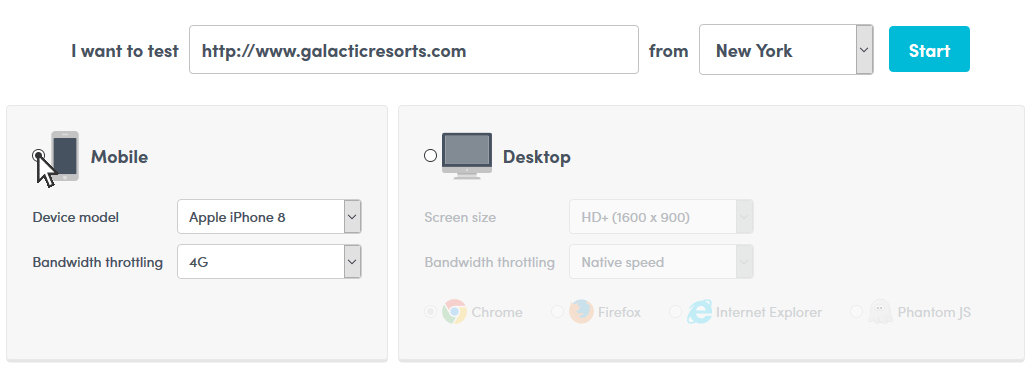
2. Test your mobile site
We’ve all heard the phrase, “Mobile first,” so not only did we put the mobile option in the honored first spot, we default to it too.
We know you want to make sure your mobile users get the best experience possible, so go ahead and try it right now.
Also, remember that Google now puts a lot of emphasis on mobile page speed for your page rankings.
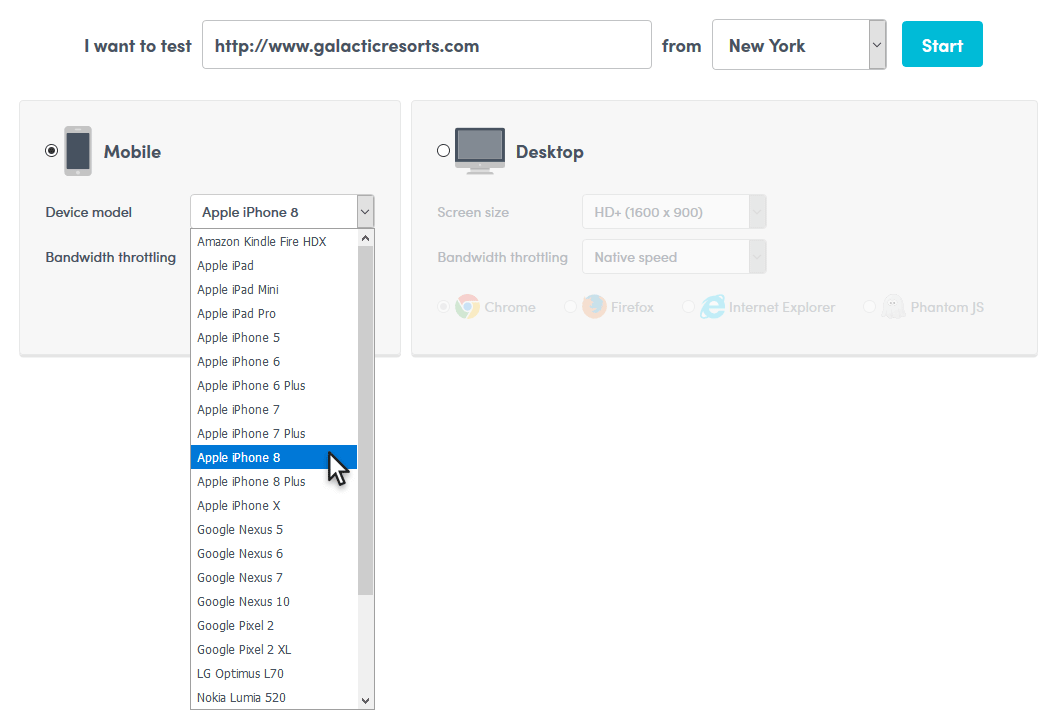
3. Test your mobile user experience based on 25 different mobile devices
Yes, 25 different mobile devices to choose from when you test your mobile website.
That’s 25 commonly used devices.
Your options include tablets and phones from:
- Amazon,
- Apple,
- Google,
- LG,
- Nokia, and
- Samsung.
Our Website Speed Test Tool simulates these devices by altering the user agent in the request.
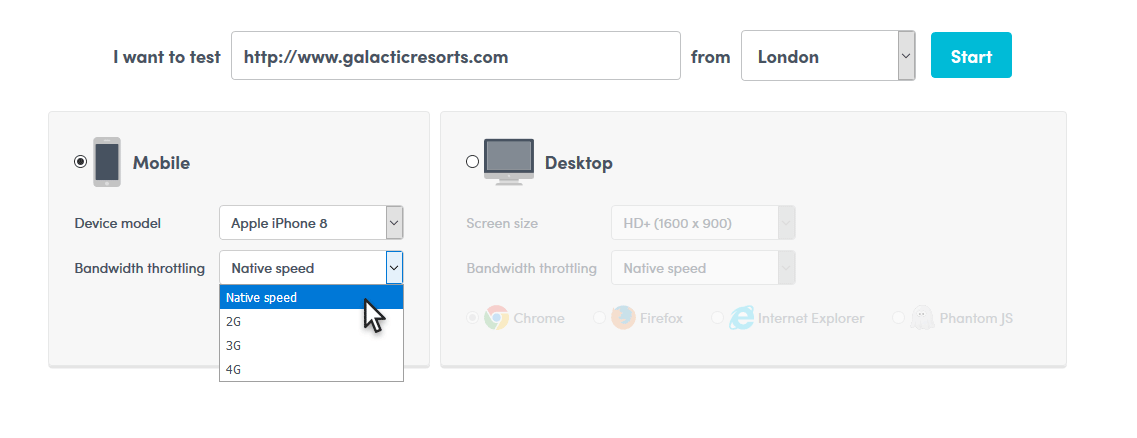
4. Use mobile bandwidth throttling
Your site might do well over a 4G network, but how about a 2G connection?
Our free Website Speed Test Tool lets you choose between native speed (No throttling, so you might want to think of this as Wi-Fi.) or a 2, 3, or 4G network using simulated throttling.
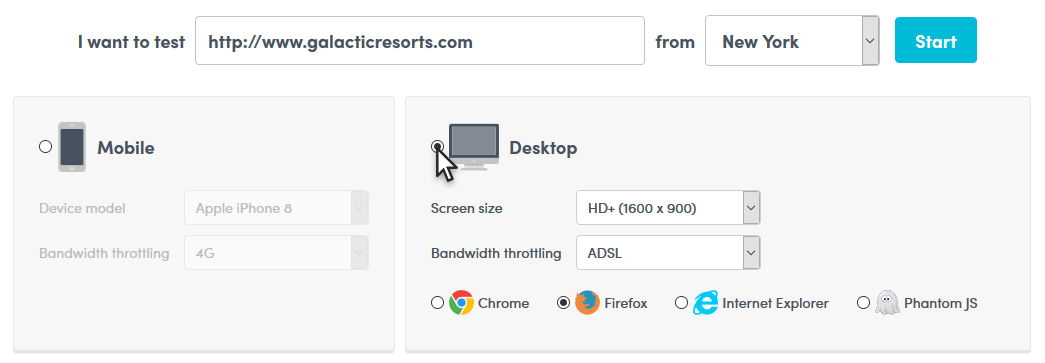
5. Test the responsiveness of the desktop version of your website
The second option on our free Website Speed Test Tool lets you check the responsiveness of the desktop version of your website.
Our free Website Speed Test Tool gives you plenty of options to ensure the happiness of your desktop users as well!
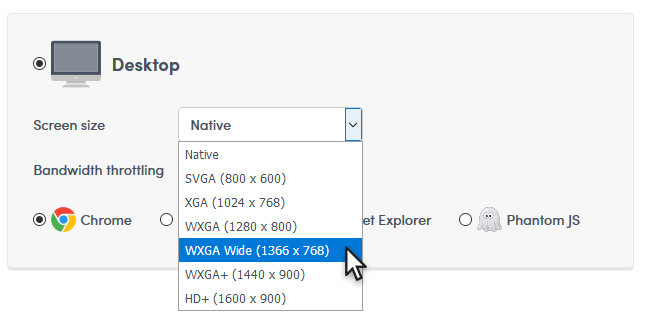
6. Test different screen sizes
Hopefully, you’re sending content based on your users’ screen real estate.
Don’t waste bandwidth, load time, and user data by sending content that needs resizing by the browser to fit the screen.
To make sure you’re getting the performance improvements you expect from your responsive design by adjusting the screen size for your testing.
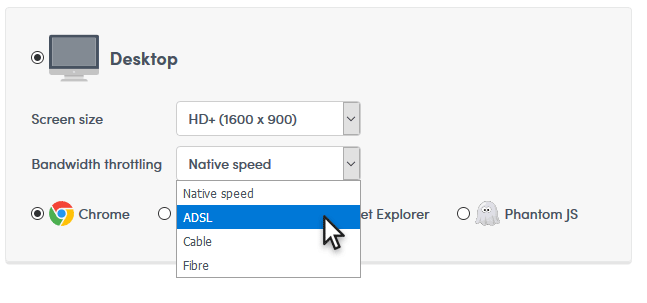
7. Desktop bandwidth throttling
There are those unfortunate few users that still rely on dial-up connections, but we already know what their experience is like—bad.
However, you probably have users accessing your website using ADSL, cable, and fiber, so we’ve made sure you can test each of their experiences with simulated bandwidth throttling.
8. Real multi-browser testing
Different browsers handle content differently, so we’ve given you a choice of four real browsers.
Our checkpoints load the most current version of your chosen browser for your tests.
We’ve got the current versions of Chrome, Firefox, IE, and Phantom JS native on all of our checkpoints.
Currently, according to W3Counter, 55% of visitors use Chrome, followed by Safari at 14%, and Firefox and IE fighting it out for third place with 5% and 6% respectively.
Considering that there are 4,156,932,140 global internet users, you still have potentially over 457 million Firefox and IE users that you don’t want to forget about.
If you’re wondering about the fourth option, Phantom JS is a headless browser used by many developers for testing and automation purposes.
Learn more about Phantom JS on Wikipedia.
Take all four for a spin! See which browsers gives your users the best and worst experiences and adjust your site to keep them all happy.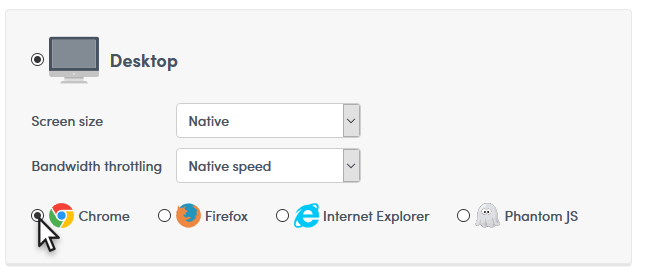
All of these customizations are available to you before you start the test; once you hit that Start button, you will lose yourself in the amount of data this one test generates!
9. Get your Google Pagespeed score
The first thing you’re going to notice is the Google Pagespeed score.
The Google Pagespeed score rates how well your page follows common performance best practices.
You’ll know exactly how Google sees your page.
Scored from 0 to 100, we hope you only see green; if you see yellow or red, you’ve got some work to do.
Don’t forget, page speed is a factor in page ranking.
10. Key metrics right up front
Next to your Google Pagespeed Score, you get your
- load time,
- page size, and
- number of requests
right at the top of the page.
We also include your test parameters for easy reference.
11. Learn how to improve your website performance
It’s one thing to know your page needs optimization, but it is another to know what is going to give you the biggest bang for your efforts.
We’ve gathered the information from Google’s Pagespeed Insights, and we’ve prioritized the tasks from high impact to low impact, so you know which tasks will improve your page the most.
Click the Show how to fix link to get detailed information about the fixes you need to make.
12. Detailed interactive page insights
What is weighing your page down?
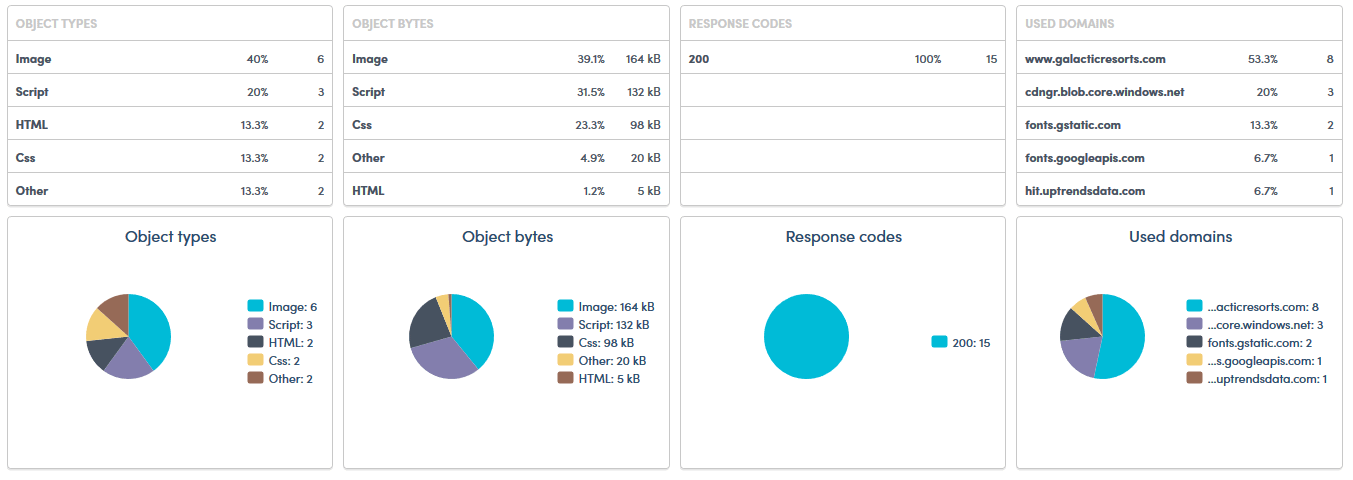
Get the actual size and ratio of your page elements available in a convenient table with interactive pie charts.
Examine your page response codes and the domains used to build your page.
All of these details add up nicely to give you a comprehensive view of your websites performance.
We break out the details based on object types, size, response codes, and the domains used.
13. See your page load progression in an interactive waterfall report
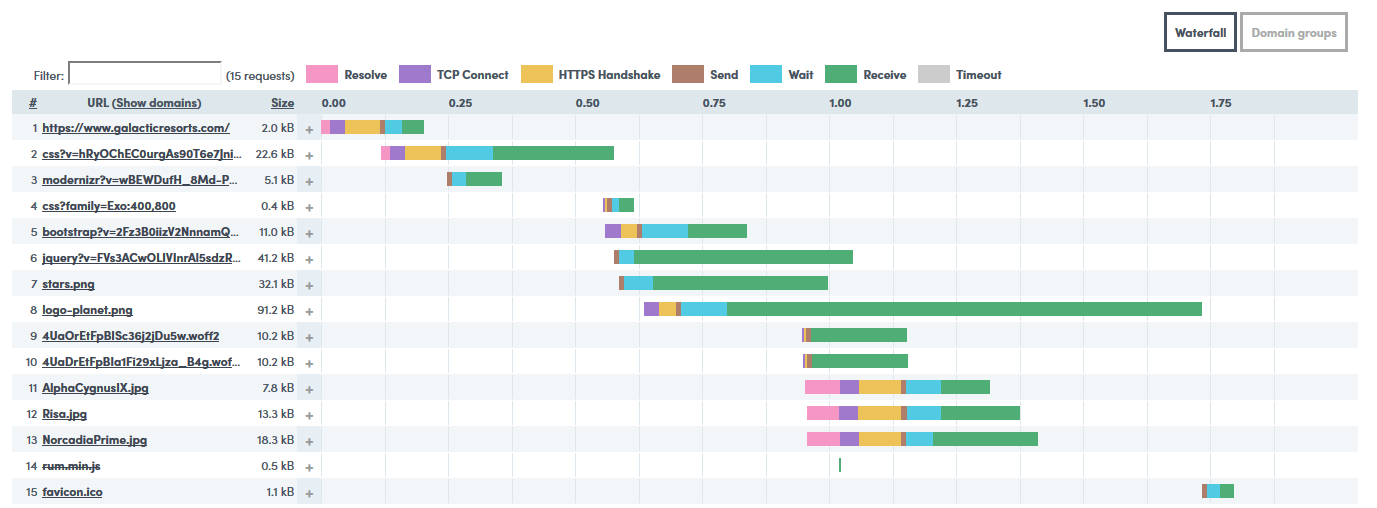
The waterfall report tells you the order your page elements load, and you can quickly see the bottlenecks caused by render-blocking elements.
In this view, you can see the page’s progression from the first to the last request.
Do you want the exact numbers?
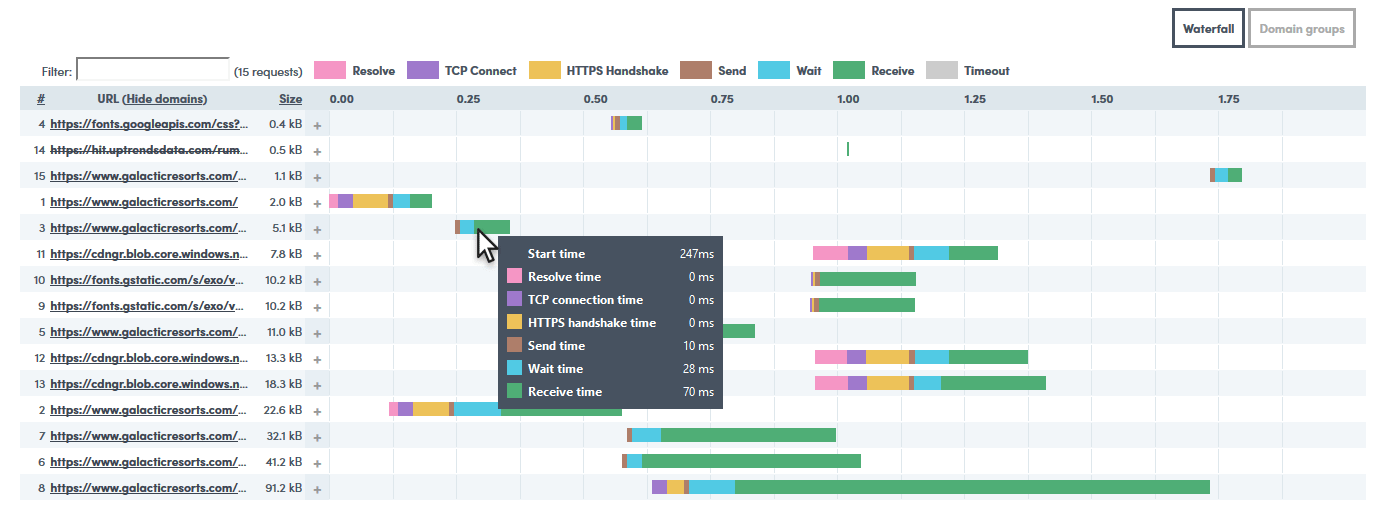
Just hover over the progression bar for any element to get the details about its:
- Start time,
- Resolve time,
- Connect time,
- HTTPS handshake
- Send
- Wait
- Receive
- Timeout
14. Full request and response headers for each element
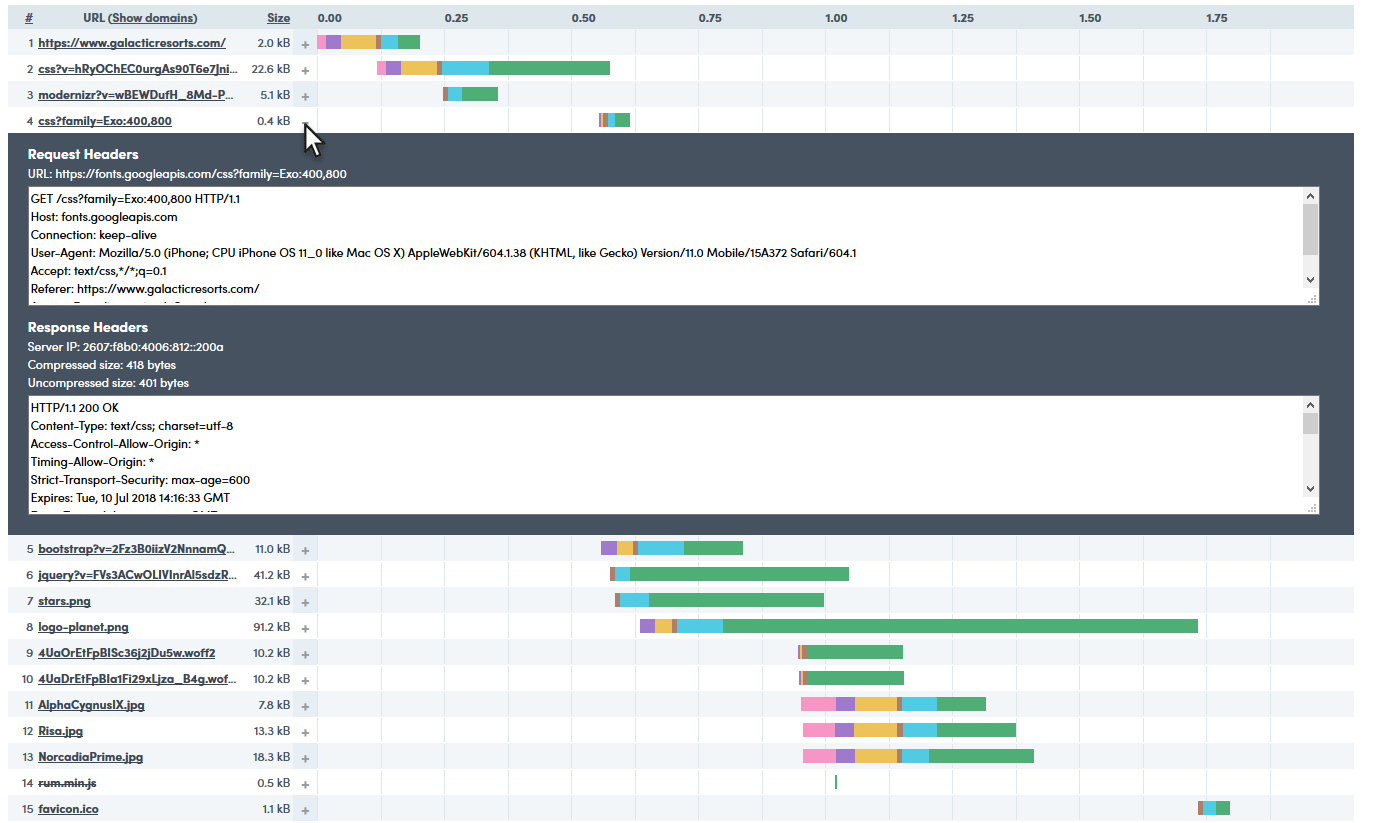
We give you the full request and response headers for faster problem resolution.
Just click the plus (+) sign next to the element’s URL.
15. Filter and sort your elements
When you have hundreds of elements, it is helpful to have the ability to sort and filter elements so that you can find them quickly.
Just start typing in the Filter box, and the tool adjusts the waterfall.
Also, the waterfall report lets you sort your page elements based on size and load order.
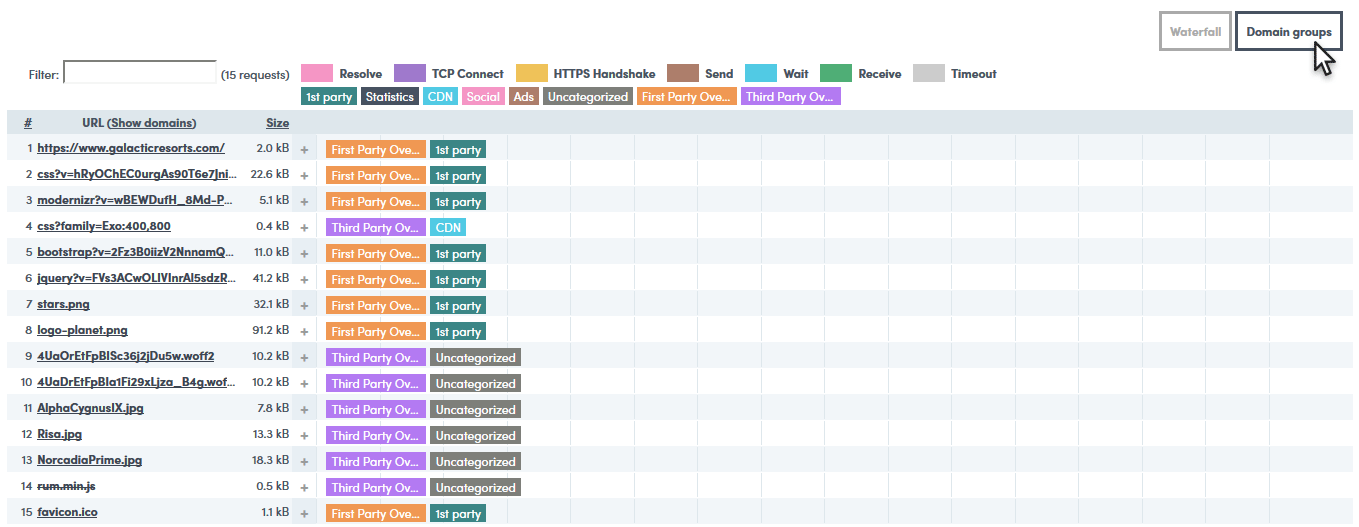
16. Use Domain Groups to spot third-party content quickly
The Domain Groups tab identifies the elements based on first party, third party, social, CDN, and statistics.
If you subscribe, you can define your domain groups for even easier identification.
17. Get your performance averages
The average times for things like your resolve, TCP connect, HTTPS handshake, send, wait, and receive times can clue you in to any front- and back-end issues as well as latency and content problems.
18. It’s free
You can access our tools around the clock to check on your site from one of our worldwide locations for free, and we encourage you to do so.
Better yet, let us check your page performance for you as frequently as every five minutes, and we will let you know when your website is in trouble.
Use the Automate my tests button at the top of the free Website Speed Test Tool page to start your free trial, and we will start your trial with the Full Page Check already set up for you.






Leave a Reply