
We all read them, and we all have our favorite technology news and media sites. Now that mobile dominates the market and Google has shifted to ranking based on mobile performance, we thought it would be fun to see how ready the top 50 technology news and media websites are for the shift using our free Website Speed Test Tool.
For those of you in a hurry:
| Metric | Mobile | Desktop | ||
|---|---|---|---|---|
| Average | Median | Average | Median | |
| Load time (seconds) | 8.5 | 7.4 | 4.9 | 3.8 |
| Page size (kB) | 2087 | 1740 | 3786 | 2289 |
| Requests | 140 | 131 | 165 | 130 |
| Google Pagespeed score | 68 | 71 | 68 | 71 |
As you can see from the data, we can conclude that the sites are not ready for a mobile world, and on average, they don’t do that well on the desktop either.
So, with that determination out of the way, let’s take a closer look at our testing methods and who finished on top and who had the worst mobile and desktop performance.
Website speed test methods
As much as we would love to dive directly into the results, we realize that you probably should know more about our testing process.
We gathered the list of the top 50 technology news and media sites from Alexia, and we tested their homepages for both mobile and desktop performance using our revamped free Website Speed Test Tool.
We did decide to pull a few sites from our research that redirect away from their homepages to subscription signup pages, and we found one site that hasn’t been updated since 2011 that we feel doesn’t meet our criteria (How did that even make the Alexa list?).
We collected lots of website performance data
The Website Speed Test Tool gives you the option of testing from nine of our 184 worldwide locations, so we ran our tests and collected data using the New York City checkpoint.
We ran each test on each website twice: once for the mobile site and once for the desktop site, and we will get to the details of those tests in a moment.
We do need to let you know that due to the one-time nature of each test, momentary fluctuations in network traffic may have influenced some results.
However, if we felt that a test didn’t reflect the site’s performance accurately due to an Internet hiccup, we retested to verify the initial result.
Using the free Website Speed Test Tool, we gathered key metrics including:
- Load Time,
- Page Size,
- Number of requests,
- Google Pagespeed Score,
- Object types,
- Object bytes,
- Response codes, and
- Resolve, TCP connect, HTTPS handshake, send, wait, and receive times.
Each test also includes recommendations from Google’s Pagespeed Insights with detailed information about what you can do to improve your site’s performance, and Google prioritizes them based on the potential impact.
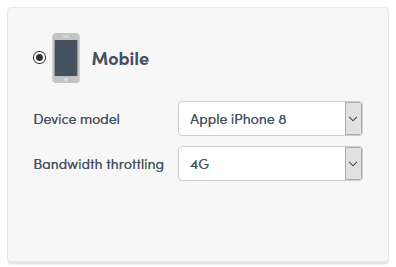
How we tested for the mobile website speeds
The free Website Speed Test Tool supports mobile testing with the option to choose between 25 different simulate devices from leading manufacturers: Apple, Amazon, LG, Nokia, and Samsung.
You can choose between four different network speeds (native speed or simulated 2G, 3G, or 4G connections) using a current version of a real Chrome browser.
For our testing, we used an Apple iPhone 8 over a 4G connection.
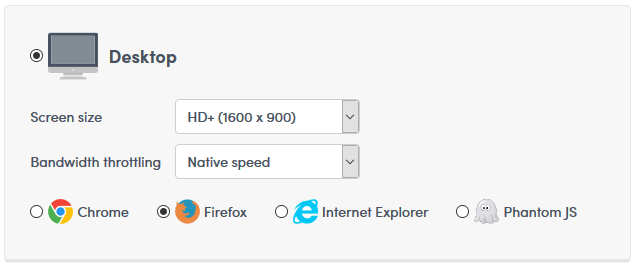
How we tested for the desktop website speeds
The desktop website testing options include screen size (great for testing responsive designs), common connection types (simulated bandwidth throttling) including fiber, cable, and ADSL, and, the most exciting, four options for real multi-browser testing with current versions of Chrome, Firefox, Internet Explorer, and Phantom JS.
For our tests, we used an HD+ (1600 x 900) screen size, at native speed (as fast as the checkpoint can go) with the current Firefox browser (61).
All right! You know how we did our testing, so let’s get to the results.
Mobile Website Speed Test Results
The drive for mobile first performance optimizations is more important than ever with Google now ranking sites on their mobile performance, but some sites seem to be taking that more seriously than others.
Users expect a site to load in two seconds, and 53% of mobile users abandon a site that takes longer than three seconds to load on a mobile device.
Let’s take a look at our best and worst mobile performance times.
Mobile websites with an eye for speed
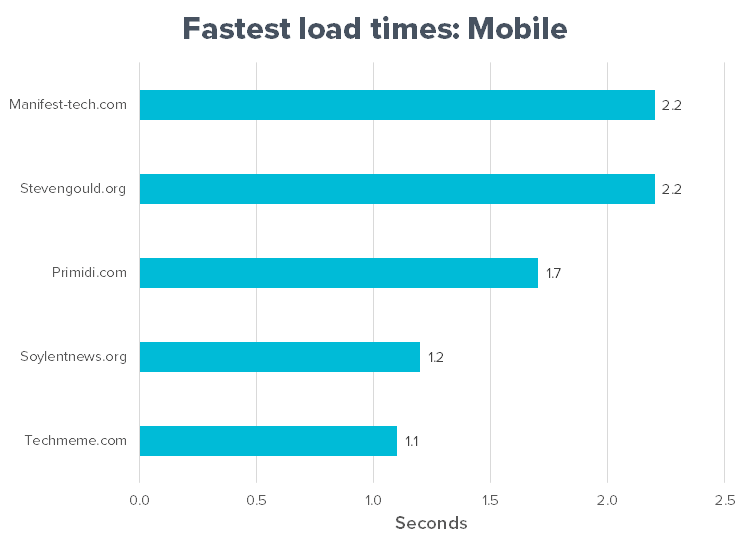
With the desired load-time goal of three seconds or less on mobile in mind, our test revealed five sites that met the three-second goal:
- Techmeme.com at 1.1 seconds
- Soylentnews.org at 1.2 seconds
- Primidi.com at 1.7 seconds
- Stevengould.org at 2.2 seconds
- Manifest-tech.com at 2.2 seconds
Indicated in the chart below, Techmeme.com finished with the fastest load times at barely over one second, followed closely by Soylentnews.org.
Of course, all of our top five fastest loading sites did well with load times under the three-second mark, but an honorable mention goes out to Bitpipe.com and XRDS.acm.org for coming in right at 3.1 seconds (you’re almost there!).
Mobile sites that need an energy boost
According to a recent Google study, mobile page load times from one to three seconds has a bounce probability of 32%.
Add a couple of seconds to that first three seconds, and the probability of bounce increases to 90% at five seconds.
At ten seconds the bounce probability jumps to 123%.
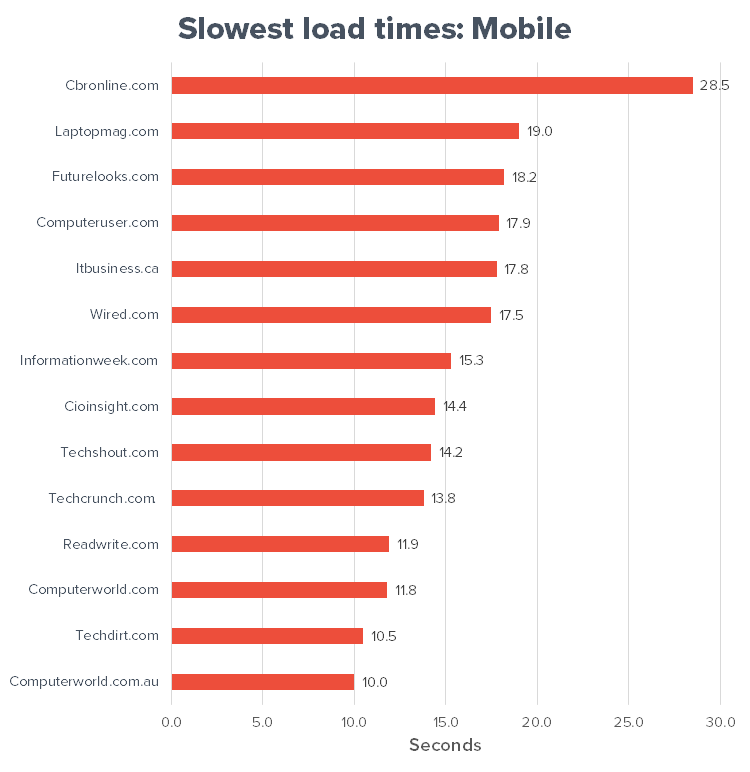
So, when we observed 14 of our tested sites having load times above ten seconds, we were a little surprised.
Computer Business Review’s (CBR) mobile speed clocked in at 28.5 seconds nearly ten full seconds slower than the second slowest Laptop Magazine at 19 seconds.
It also surprised us to see that Alexa’s number two rated technology news and media site, TechCrunch, in the list of the slowest 14 sites.
Mobile website speed: a closer look
As you saw above, the difference in performance between the fastest and slowest sites is extreme.
In fact, the fastest site and slowest site have a difference between them of a whopping 27.4 seconds.
With that in mind, let’s take a look at the details that influenced the performance revealed by our free Website Speed Test Tool.
Google Pagespeed Scores mirror our findings
Google rates pages based on their performance and the performance optimizations that the site uses, and Google scores each page from zero to 100 with 100 being a perfectly optimized page.
For the most part, we found that the Google Pagespeed Scores agree with the performance revealed by our Website Speed Test Tool.
In the chart below, we have the top five and bottom 14 performing sites’ Google Pagespeed scores.
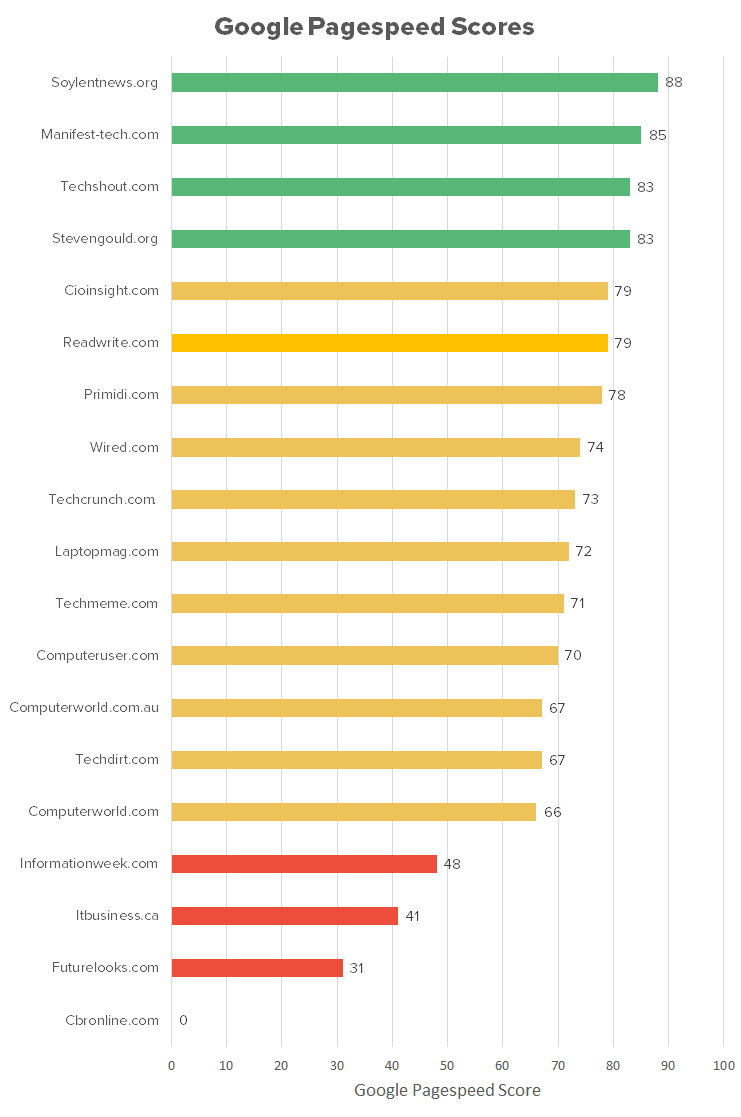
Did you notice that our fastest mobile site, Techmeme, received a Google Pagespeed Score of 71?
How does a site that loads in 1.1 seconds receive a mediocre score?
Although Techmeme has minimized their page size, there is still more they could do to improve their performance even further by enabling compression, using browser-side caching, and optimizing images.
Also, our worst performing site, CBR, received a zero from Google Pagespeed Insights mostly due to poor image optimization (zero scores appear as “-” on our tool).
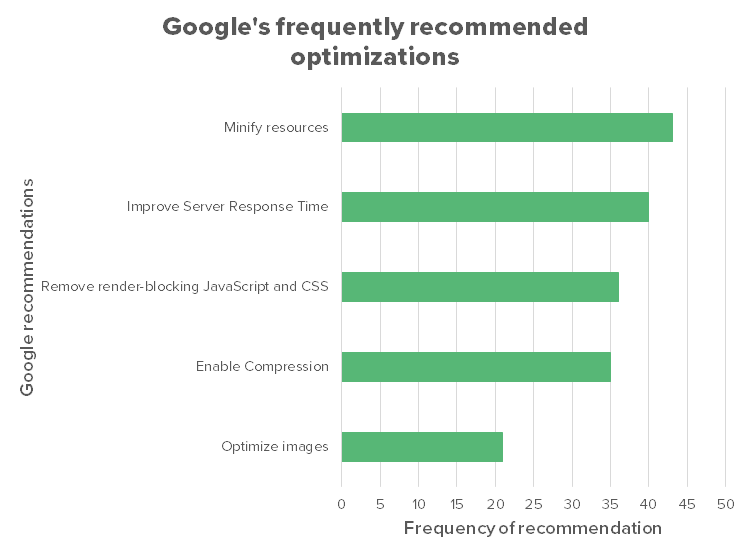
Let’s take a moment to explore the most common Google Pagespeed Insight recommendations made for our tested sites.
Google Pagespeed Insights recommendations
The performance improvements available with the Website Speed Test Tool, provided by Google Pagespeed Insights, makes prioritized suggestions for optimizing the tested page.
For example, Google Pagespeed Insights strongly suggests that CBR, who received a score of zero, reduce their page size by 95% by optimizing their images.
Other commonly suggested optimizations for all of the sites include:
- Removing render-blocking JavaScript and CSS files,
- Prioritizing visible content,
- Leveraging browser caching,
- Enabling compression, and
- Minifying resources (JavaScript, CSS, HTML).
Google prioritizes the optimizations for high-, medium-, or low-performance impact, and of the list above, Google suggests minification of resources the most often as a low-impact optimization.
Although less frequently recommended, Google suggests that image optimization, enabling compression, and removal of render-blocking CSS and JavaScript as high-impact improvements that many of the 50 tested sites need to consider.
The chart below shows the number of times we saw each recommendation while testing the 50 sites.
Of course, there are several other suggestions such as “Improve server response time” that occurred less often, so we didn’t include them here.
Impacts due to page size and the number and types of requests on mobile websites
Many factors impact the performance of any page such as page size and resource requests.
The more content you throw onto a page, or the more sources required to build that content, the higher the performance hit.
So, it goes without saying that reducing the total page size and the number of requests are important to your site’s performance.
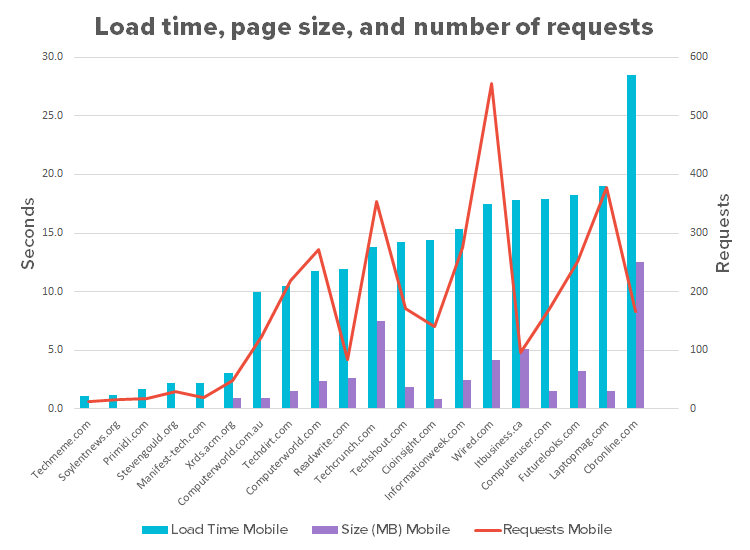
In the following charts, we have the top and bottom performing sites lined up from left (fast) to right (slow).
You will quickly notice the near lack of bars for our fastest sites and the erratic data coming from the slowest sites as different combinations of page size, data types, and request counts reduce their load times.
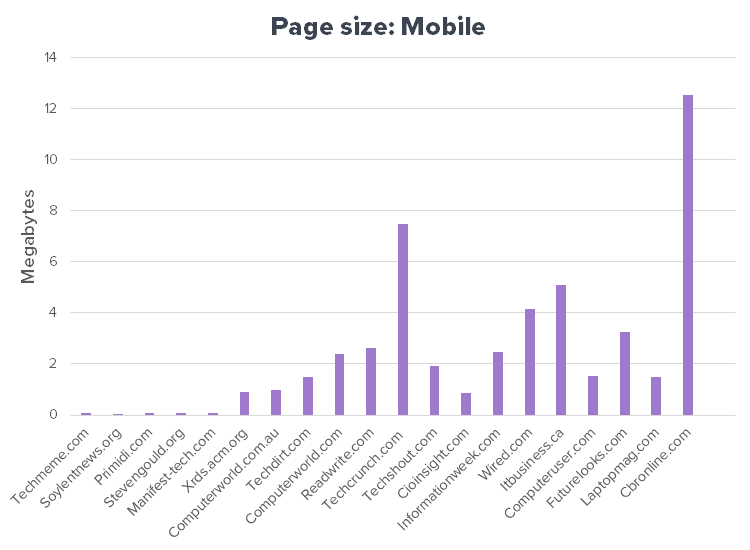
Latency aside, reducing page size is a major contributing factor to improve page load times.
CBR has more than 12 MB of data on their homepage at the time of testing, but Laptopmag.com, the second slowest site, has less than two megabytes of data, suggesting that something else is also contributing to extending its load times.
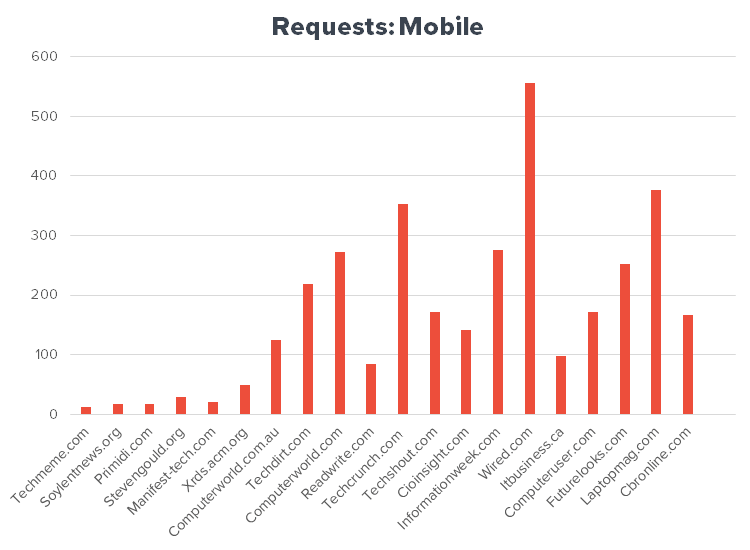
Now, looking at the number of requests required to load each page, we see a slightly different story.
For most of our slower mobile sites, the number of requests is a problem; for example, Laptopmag.com‘s 377 requests and Wired.com‘s 555 requests are undoubtedly contributing to their slower load times.
Placing all three metrics into a single chart (below), you can see the combination of elements that contribute to each site’s success or failure.
For CBR, the number of requests is much less of a factor than their page size, while Wired (and most of the others) need to reconsider the number of requests made.
TechCrunch gets a double whammy with a 7.5 MB page size and 353 requests; reducing either or both would improve TechCrunch’s load time.
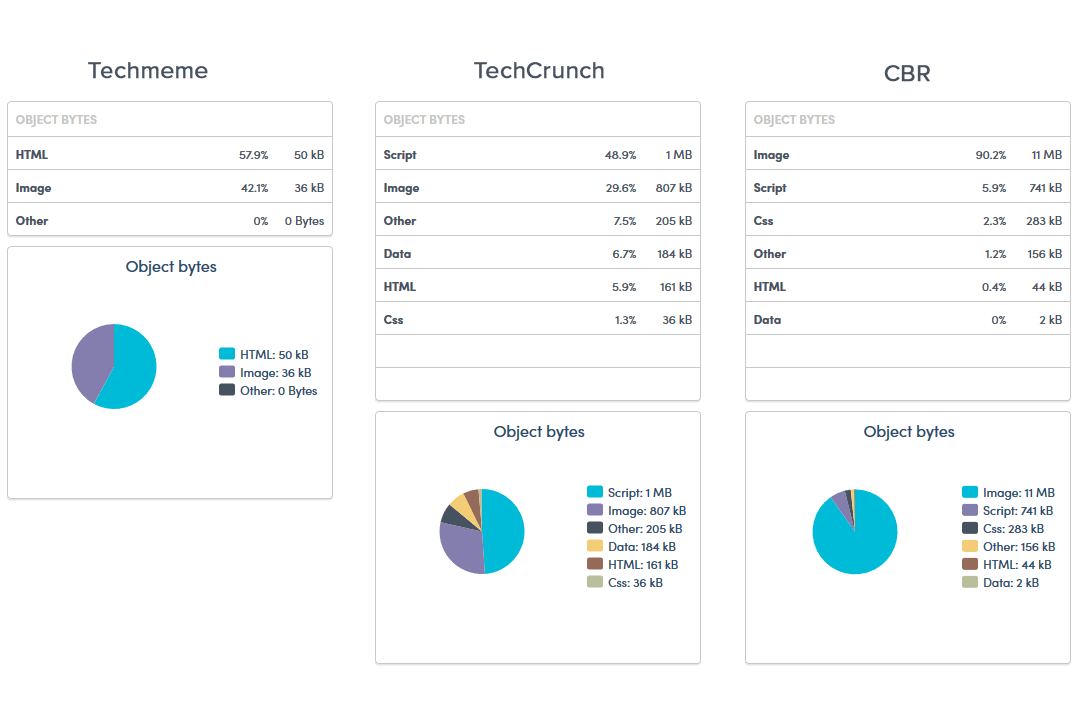
A closer look at three of the above sites using the free Website Speed Test Tool, you quickly see that out of CBR’s 12 MB page size, 11 MB or 90.2% of the content consists of images (see below).
If CBR optimized their images, according to Google Pagespeed Insights, they could cut their page size down to 5 MB.
Nearly 50% of TechCrunch’s 7.5 MB page size is due to script files, and seven of TechCrunch’s JavaScript files are render blocking slowing down their page load times.
Techmeme, the fastest mobile site, has nearly 60% of its page size coming from HTML files, but, at 86 kB for the entire page, the page size isn’t a factor for them.
Desktop Results and mobile site comparisons
With the move towards mobile speed for Google rankings, we decided to take a brief look at the top and bottom results from the Website Speed Test Tool’s results for our technology news and media sites followed by a detailed comparison of how the top and bottom sites’ desktop results compare to their mobile results.
Desktop Results
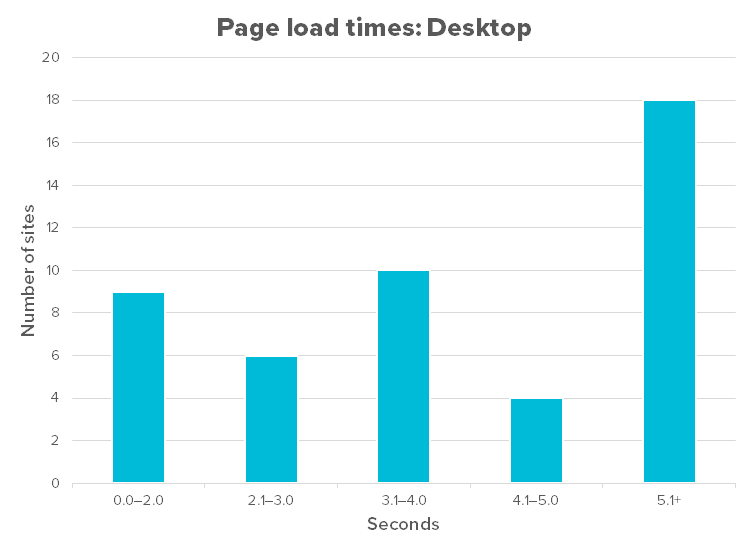
For the desktop version of a website, research dictates that the page load in two seconds or less, and nine of the 50 sites made the two-second goal.
Unfortunately, that means most of our sites didn’t make the cut.
In fact, five of the slowest sites clocked in with load times above ten seconds.
Top Performing desktop sites
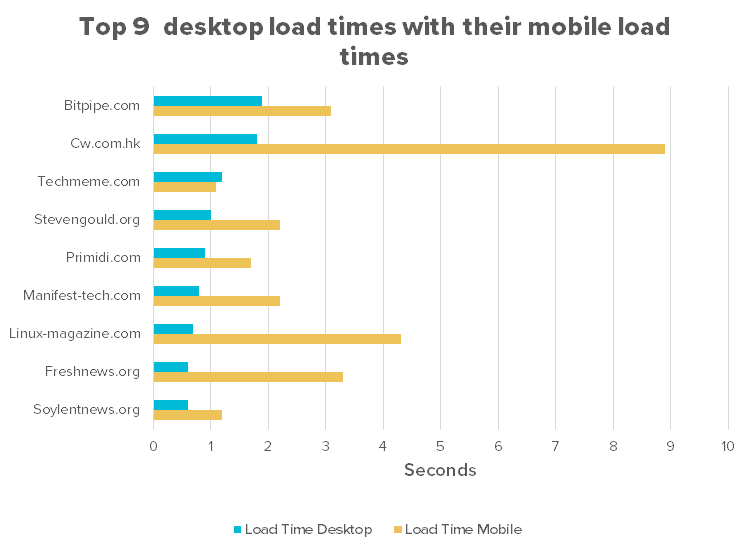
Our top nine performing websites on the desktop all had load times under two seconds, and all five of our fastest sites on mobile also made the list of the top nine desktop sites as well.
Four more sites that didn’t fare as well on mobile also made the list of the fastest desktop sites. The four sites joining the fast website list for desktop include:
Shown in the chart below, Computer World Hong Kong (Cw.com.hk) has a significant reduction in load times on the desktop.
Unfortunately, this improvement won’t matter for SEO purposes as Google shifts from desktop to mobile speed as a ranking factor, but it does make their desktop users happy.
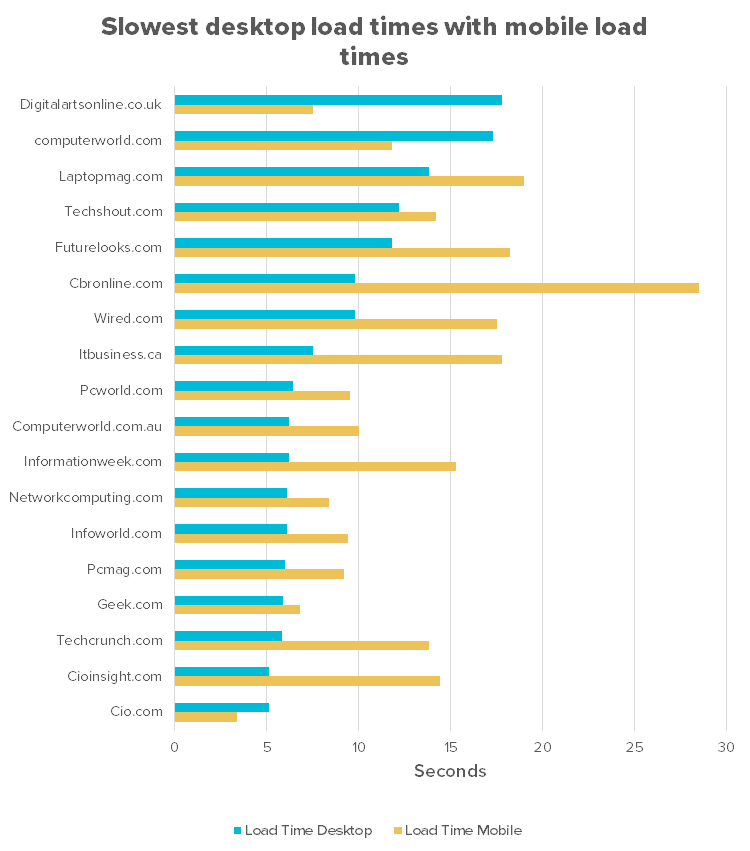
The slowest sites on desktop
With 47 sites (remember we left out sites that redirect their home page) with load times over 2 seconds, we chose to focus on the sites with load times over five seconds on the desktop.
18 of the 47 sites had desktop load times over five seconds.
As you can see in the chart below, most had major improvements over their mobile speeds, but Digitalartsonline.co.uk and Computerworld.com had higher desktop load times than the mobile results that we recorded for them.
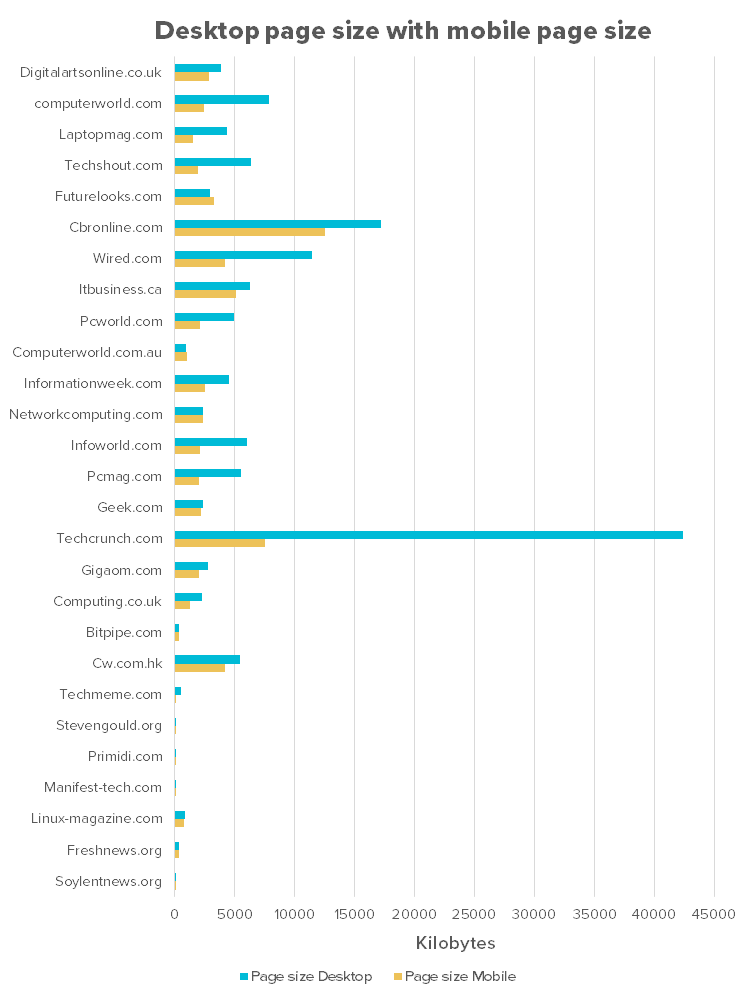
 Page Size: Desktop versus mobile
If your page size isn’t smaller for mobile than it is for the desktop version of your site, you’re doing it wrong.
The following chart shows all of the sites have either delivered a smaller page to mobile or their page size is so small it doesn’t matter which device the visitor used.
TechCrunch.com at the time of our testing delivered a 42 MB page to their visitors on desktop while delivering 7.5 MB to mobile (still too large resulting in a 13.8 second load time on mobile), but you do have to give TechCrunch credit because they delivered 42 MBs in 5.8 seconds while Digitalartsonline.co.uk took 17.8 seconds to deliver 3.9 MB.
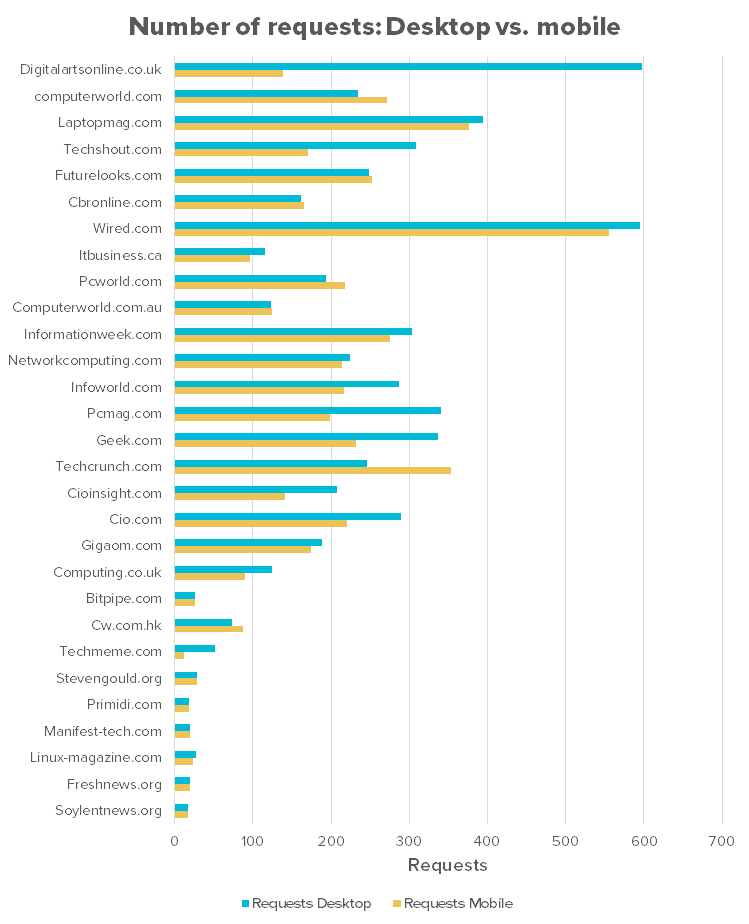
Number of requests: Desktop versus mobile
Mobile adds an extra layer of latency due to cellular networks, and like page size, the number of requests should drop when a user accesses a site on a mobile device.
Most of the sites in our top and bottom performing sites follow this pattern except for:
- Computerworld.com,
- Futurelooks.com,
- Computer Business Review (cbronline.com),
- Pcworld.com,
- Computerworld.com.au,
- Techcrunch.com, and
- Computer World Hong Kong (CW.com.hk).
All of the fast sites used the same number of requests for mobile and the desktop, or they made one or two extra requests for the desktop version of their sites.
Final thoughts
Media and news sites change their content frequently; therefore, the results of one-time tests like we’ve conducted with our free Website Speed Test Tool can vary widely from day to day.
Automating the tests would provide greater clarity into the performance of these sites as the content changes over time.
The results of our research above do not reflect on the quality of the content (and man did we see some great content), but instead, gives us a glimpse into the sites’ user experiences.
Most of the sites have a lot of work to do due to Google’s change that makes mobile performance the standard for their website performance ranking factor, and this change will have many websites across all markets struggling to bring their sites up to the new standards.
It is our hope that our free Website Speed Test Tool may play a role in helping make the Internet a better place as we all struggle to improve our mobile website performance.


Leave a Reply