You’ve done it – You’ve set up your monitors, adjusted your alert definitions, and are now reaping the benefits and peace of mind that come with website monitoring. The only question is, can you do even more? The answer is yes – with dashboards!
Capture data from multiple monitors
You could be monitoring multiple websites, or have different types of monitors set for just one website. Either way, you need a place where you can view the data gathered from your http, Full Page Check, Real Browser Check, and other monitors in one screen. Custom dashboards give you that ability!
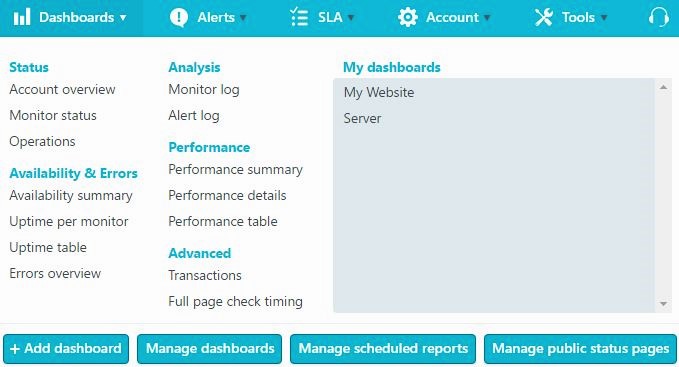
Creating a dashboard is almost as easy as creating a monitor. In your account you’ll see the “Dashboards” option in the top menu. If you click on that you have access to a variety of preset dashboards, or you can customize your own by clicking “Add dashboard”. From here you can customize your own template, or duplicate an existing dashboard. Managing your monitors has never been simpler!
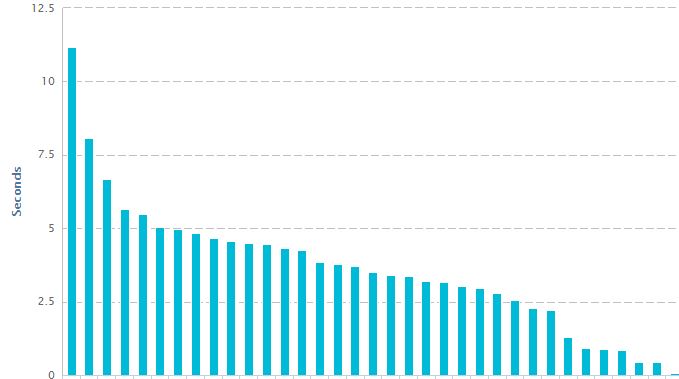
Not a fan of tables? Try a colorful graph instead!
Uptime and performance can be presented in numbers in a table, but if you prefer a visual approach try out our graphs option. Data can be organized by total load time, resolve time, connection time, uptime percentage, downtime percentage, confirmed errors, number of checks, and more! Even if you’re monitoring just one website you can compare performance across multiple browsers with Multi-browser Monitoring, or check your mobile performance with Mobile Website Monitoring. The graphs will give you everything you need to know at a glance, so you can continue with your day without ever slowing down!
Dashboard Sharing
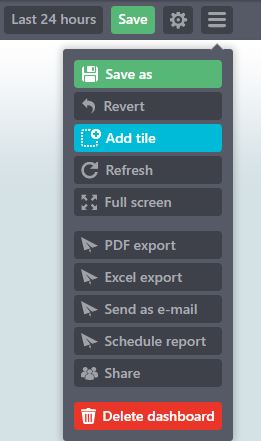
One of our key values is believing that everything works smoother when you get your whole team involved. To get everyone connected with the status of your website, consider sharing your dashboards with the rest of your team. If you’ve given other operators access to your account it is easy to share your dashboards with all of them. If you want to share it with even more people, however, you can do that too by exporting it to a PDF, excel, or email. You can also schedule reports to come in daily, weekly, or monthly! For more detailed information on dashboard sharing you can refer to this post.
Don’t forget that if you’ve invested a lot of time into creating the perfect dashboard, you can select “Save as” to save a copy for easy editing later!
Make it work for you – The custom dashboard
The custom dashboards come jam packed with features. You can create tables and graphs for checkpoint data, multiple monitors, monitor logs, alert logs, transaction step duration, and more! You can track as many of these at once as you like or keep it simple by just having one or two dashboard tiles side by side. A simple 4 tile dashboard can be great for capturing data for both uptime and performance, displaying all of the relevant information across different data tables and graphs.
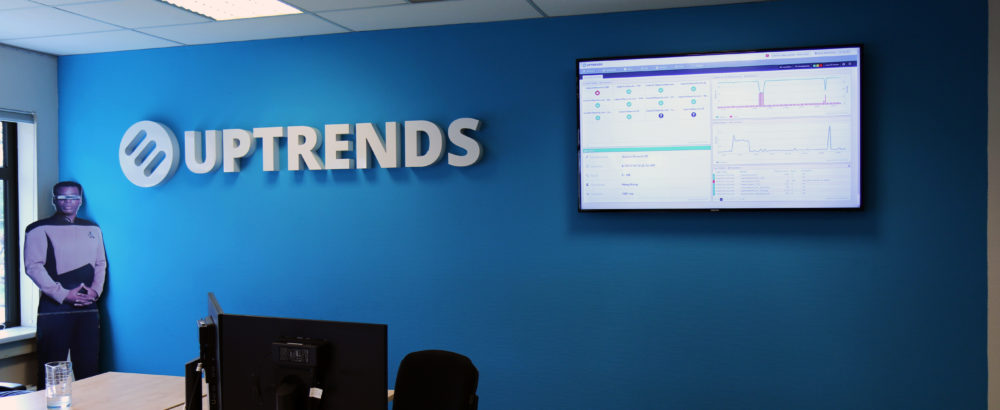
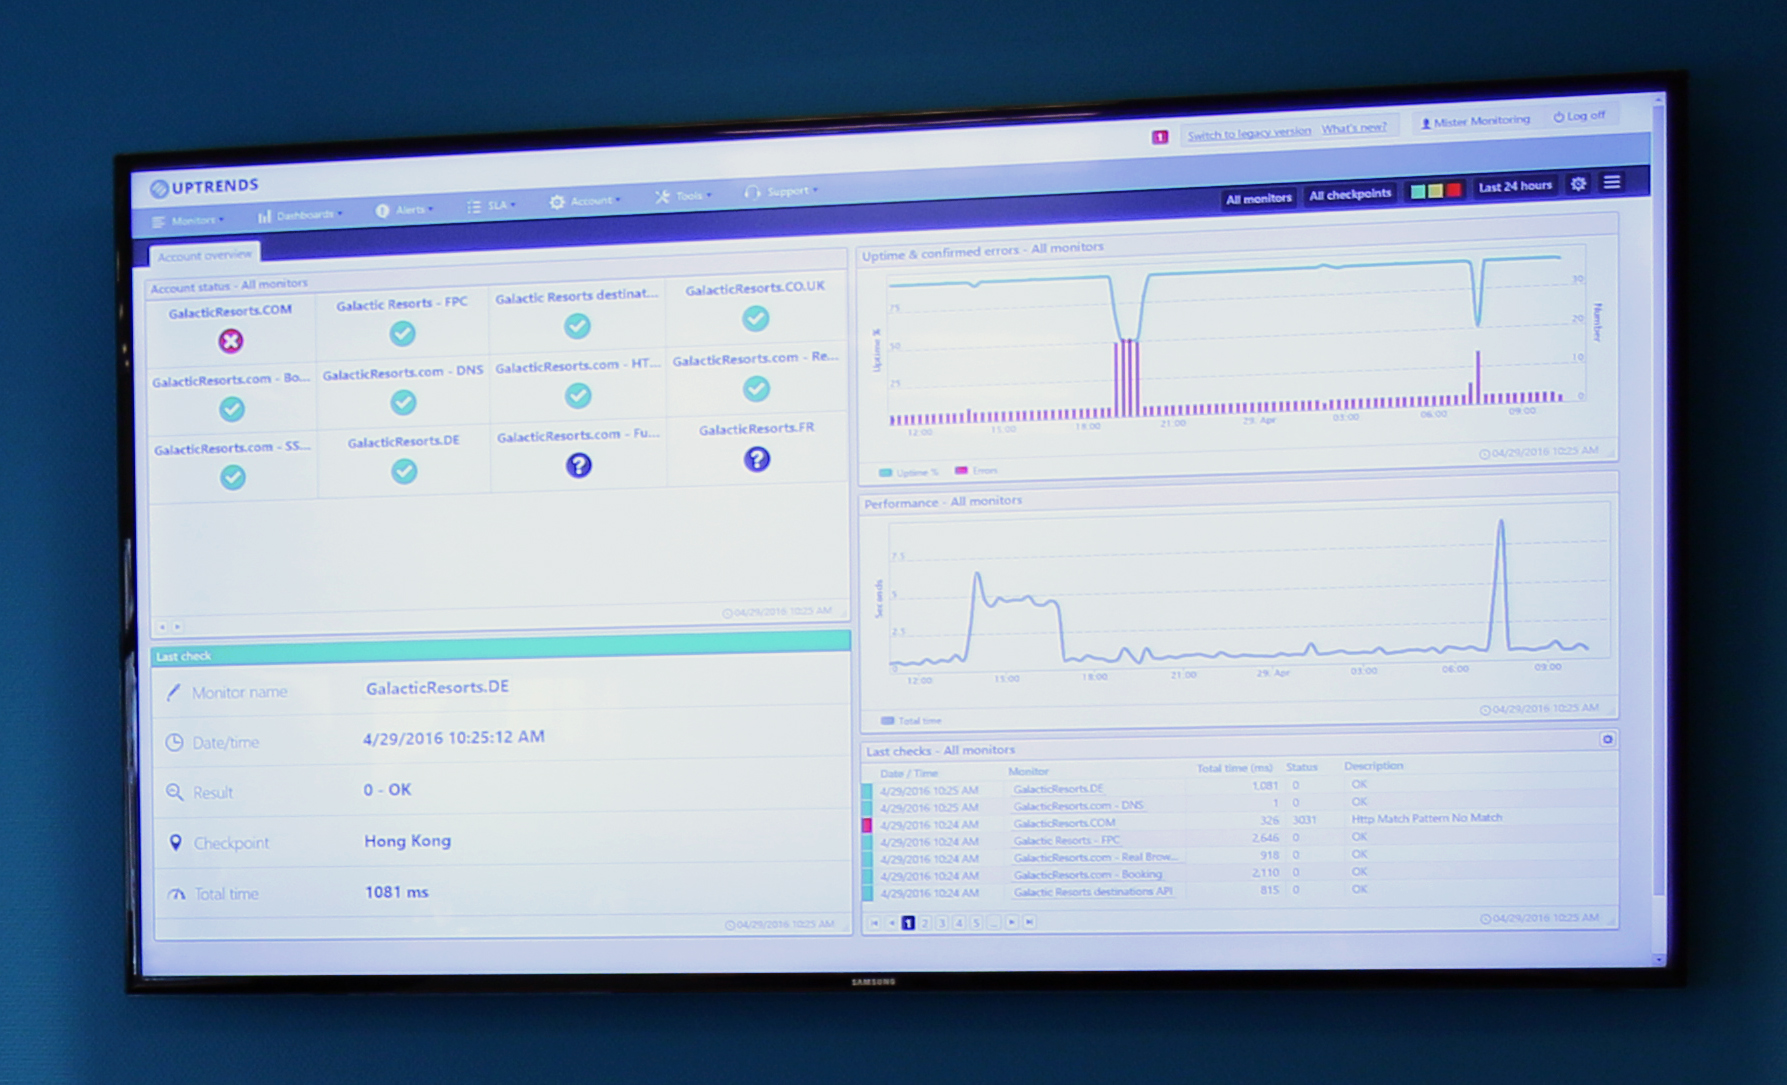
Show your dashboard on a static screen
You’ve created the perfect dashboard and all of your metrics are displaying beautifully. Why not throw it up on a big monitor in your battle station? Keep yourself and the rest of the team up to date on the current status of your website and set an error alert sound to go off if a problem arises. With the right tools you’ll never have to be surprised with downtime or slow performance ever again!
Have you found other useful tips for getting creative with your dashboards? Let us know!


Leave a Reply