Our HTTP and HTTPS monitors have been great for staying on top of uptime, but what if there are specific errors you want to keep an eye out for? Available immediately is our new expected status code option for both HTTP and HTTPS checks.
What is it?
Previously, the HTTP monitors verified that a response is returned without any errors. When the monitor does detect an error, it will know that a problem has occurred. We confirm that error from a second location, and then you get a notification a moment later.
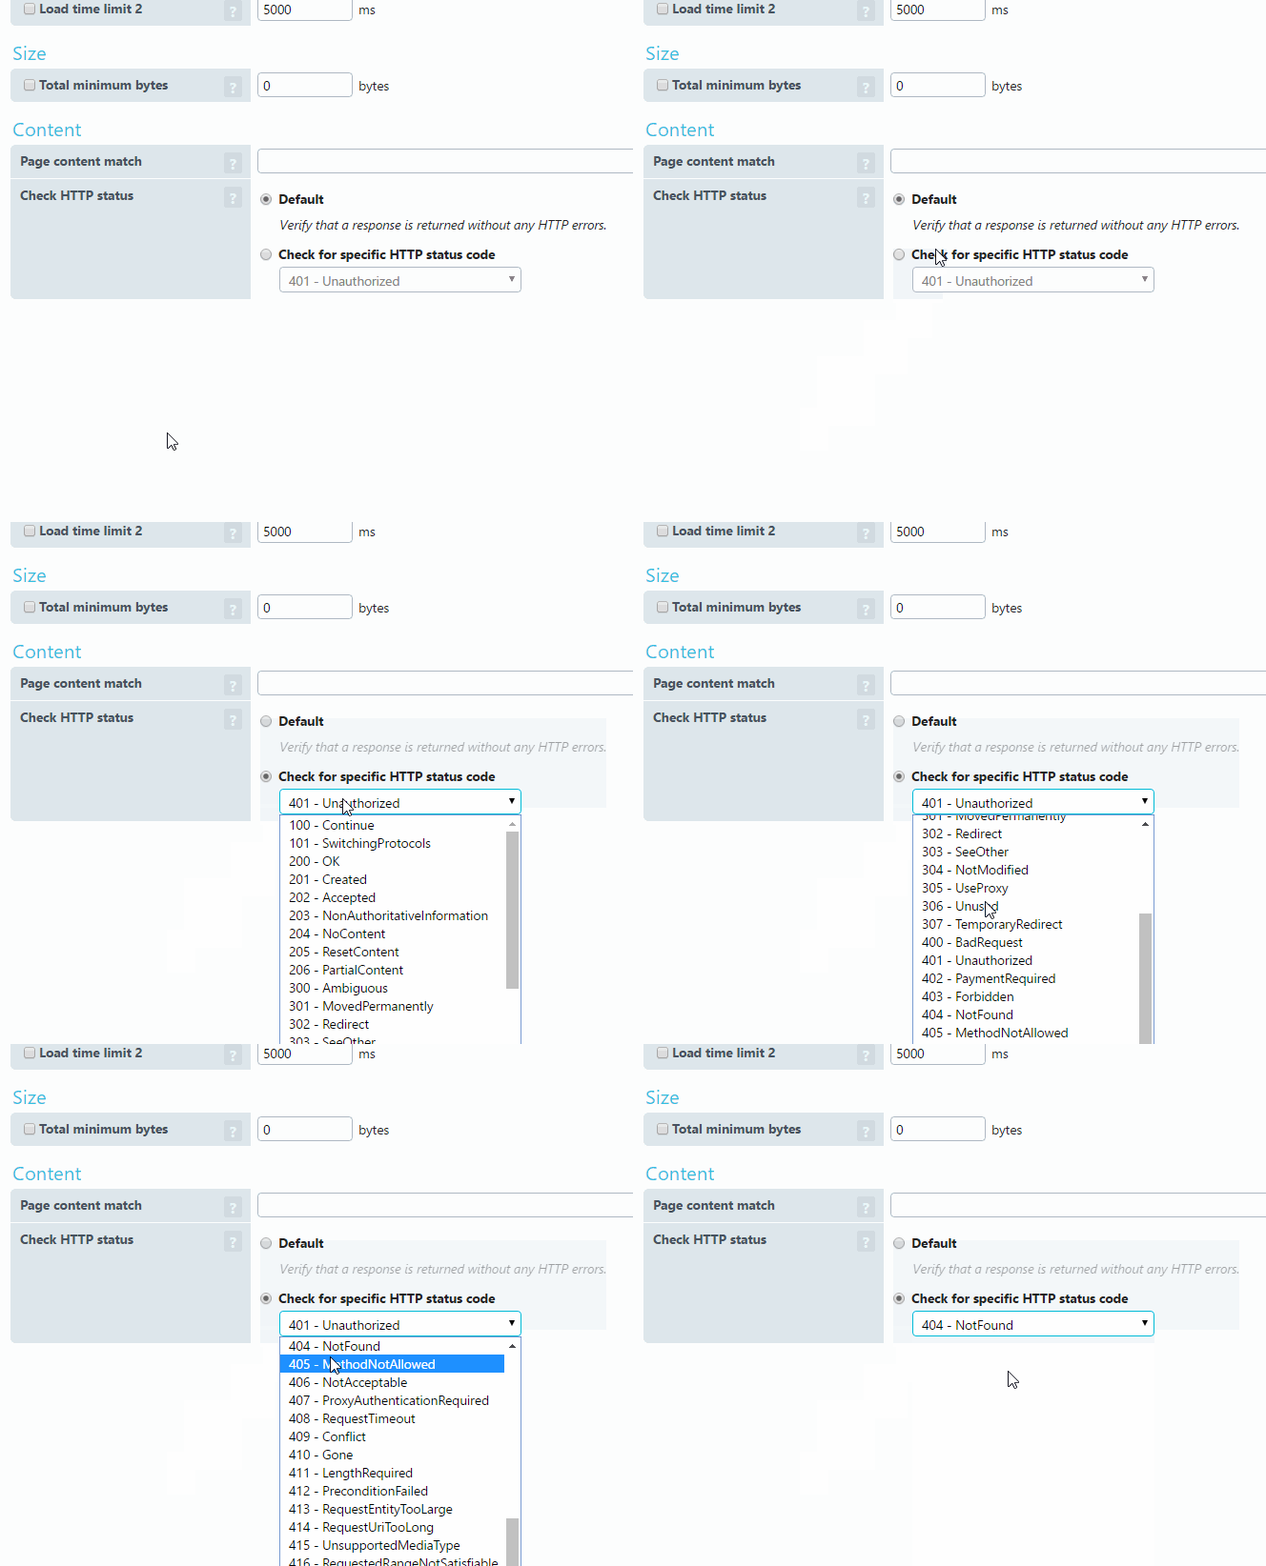
Now, you can specify which status code you want to monitor; there are 42 different ones to choose from. You will now be able to verify redirects (301, 302, etc.), verify that the server enforces authentication (401), verify that non-existing URLs return a 404, verify that specific incorrect requests return a 400 or 500 (depending on what’s needed), and much more!
How do I set it up?
In the main menu at the top of your account select “Monitors” and click on “Add Monitor” in the dropdown menu.
For monitor type you can select either HTTP or HTTPs. Now, click on the “Alert Conditions” tab to access the error code options.
On this page you’ll see the section for “Check HTTP status”. It should be set to the default option, which is to verify that there are no errors. To change this, click on “Check for specific HTTP status code”.

From here you can select any one that you like from the drop down menu. If you want to monitor for more than one specific error code feel free to set up multiple monitors. If you load them all into a dashboard you’ll be able to keep track of all of the errors your website is experiencing on a single screen!
Anything else?
Be sure to keep an eye out for future blog posts regarding this feature. We’ll be talking more in depth about specific situations (testing redirects, testing authentication scenarios, etc).
If you have any questions our support team is more than happy to help out!


Leave a Reply