Everyone knows that web performance is everything for a quality user experience. Web performance affects conversion rates because users quickly form opinions based on a website’s or app’s responsiveness. In this article, we explore the importance of performance to your web application throughout the entire user journey, how to examine your web application performance results, and how to set up your web application monitoring to alert based on performance.
There’s a subtle difference between website performance and web application performance
The primary difference between website performance and web application performance is that the former refers to a single page’s load time while the latter refers to the website’s responsiveness to user interactions within the page and possibly across multiple pages or even other domains.
Take for instance,
You may consider a banking page that loads in under two seconds performant, but if the site takes three or more seconds to authenticate a login, the positive user perceptions due to the speed of the initial page load are challenged by the slow login process.
Performance influences user perceptions
Performance is the leading influencer on how users perceive a brand and their decision to utilize the brand’s products or services or shift their loyalty to a competitor. Akamai conducted a study that found 79 percent of e-commerce shoppers dissatisfied with a visit to a website (slow response times, slow loading pages, freezing, and crashing transactions) are less likely to buy from the site again, and 27 percent of those would not return to the site again. So, the question is why?
- Patience: 47 percent of consumers became impatient when pages took more than two seconds to load.
- Site loyalty: 52 percent of shoppers said that fast-loading pages are important to their loyalty.
- Distraction: When experiencing a slow site, 14 percent switch to a competitor while 23 percent give up and do something else entirely.
Today’s consumers demand a fast, engaging, and secure online shopping environment when searching for a product online. We see a direct relationship between online revenues and site performance, and therefore, we have to ensure our site performs well and loads fast.
Michael Cooper, Vice President and General Manager, HomeDepot.com.
Tammy Everts reports that speed correlates to consumer brand confidence, and users that receive a faster experience (as little as 500 milliseconds) have more positive perceptions of the website, the brand, and the products or services sold. You should place performance as high in importance as uptime and function. Web Application Monitoring can help you ensure a quality experience for all your users.
Use Web Application Monitoring to track transaction timings
You’ve optimized your page loads, and you’ve put Web Performance Monitoring in place to track page load performance. You’ve made great progress towards ensuring a quality user experience. And by tracking transaction timings with Web Application Monitoring, you make sure your user interactions remain fast and functioning.
What is Web Application Monitoring?
Web Application Monitoring is a synthetic monitoring type where a script performs the page interactions normally done by users on the site. The monitor validates page responses, content, and performance as it walks through the user’s interactions. After all, at the end of the day, it is the full user experience we need to keep an eye on.
Ultimately, if we care about our businesses, then all those real actual human beings should be the first and last thing we think about every day.
Tammy Everts, Time is Money
Monitoring Web Application Performance
Monitoring your web application performance is a bit of a different animal from monitoring basic page load times. Website Performance Monitoring is about a single page’s load speed, but web application performance monitoring entails so much more. Your application performance includes timing for multiple page loads. Your users expect a fast response for every click they make not just the first one.
Transactions and the load time metric
Many people put a lot of stock in their load time or total time metrics, and for most monitors, you should. However, when it comes to your transactions, your load time metric doesn’t necessarily represent your performance the way you might think it does.
Here’s the deal:
Your load time metric means something slightly different depending on the monitor type; for example, the load time for a Full Page Check monitor is the amount of time it took to formulate the request, make the request, receive the response, request and receive additional page resources, and complete the rendering and loading of all associated files in the browser.
Your web application monitor also has a load time value, and like a Full Page Check, it encompasses the time it takes to make requests and process responses, but the actual test takes longer to complete because a transaction typically has at least two server interactions and the total time metric includes all the request timings. Poor performance for a single request can go unresolved unless you examine the timings for each transaction step individually.
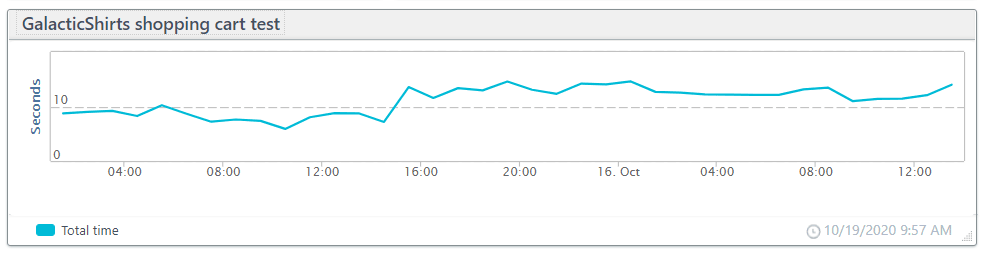
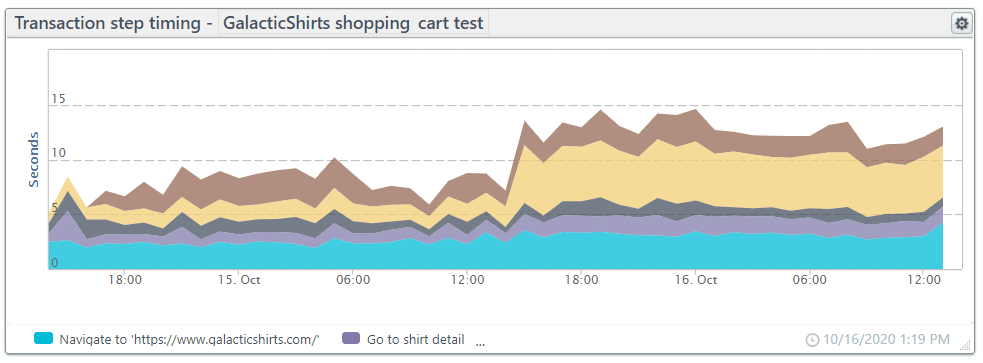
However, that doesn’t mean that your total time/load time is without its uses. Tracking the metric can clue you in on trends and sudden spikes in your transaction’s performance. The chart below shows a sudden increase in the total time metric, but the chart can’t indicate the exact problem; it just tells us we have one. However, your transaction monitor dashboard gives you more meaningful data about your web application performance.
Finding your web application performance metrics
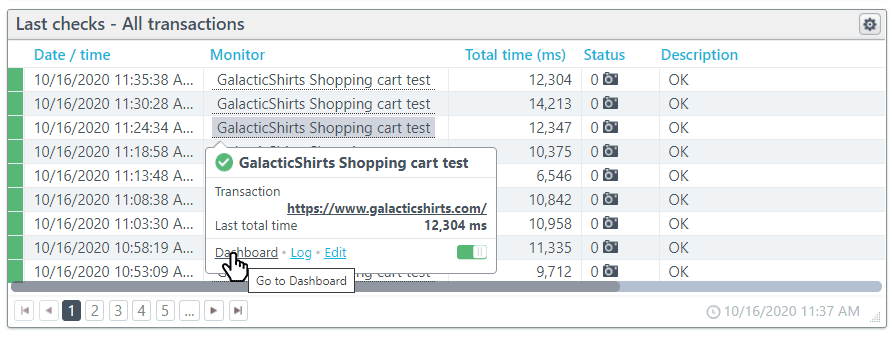
You’ll find the web application performance metrics that matter to you most in the default dashboard for your transaction. To access your monitor’s dashboard, click Dashboard on the pop-up dialog window when you hover over the monitor name in your monitor log (see figure below).
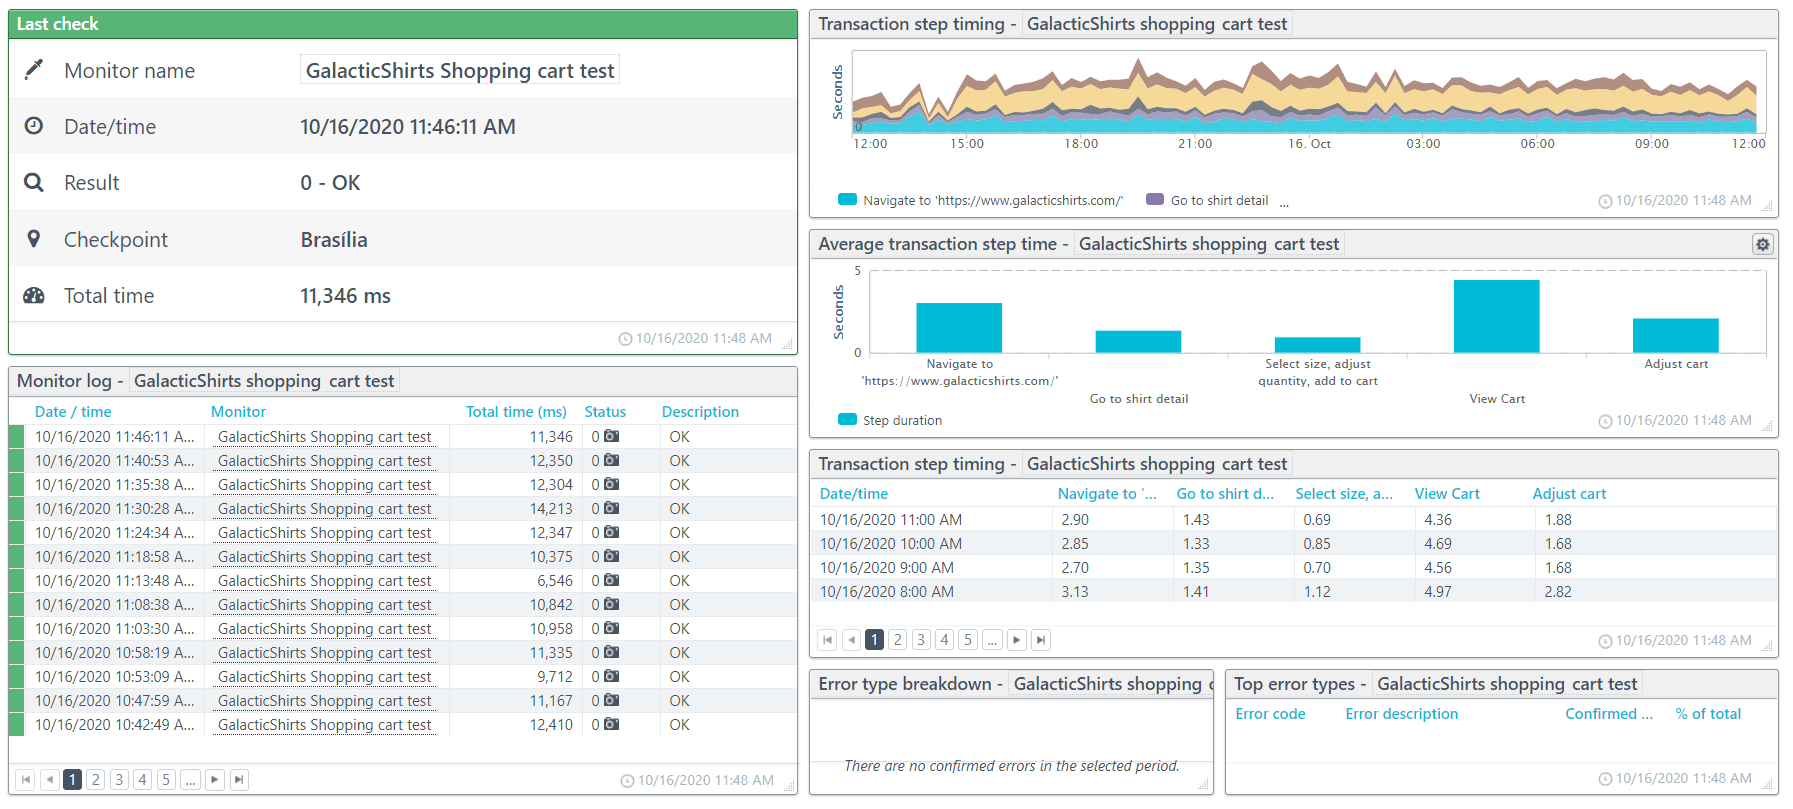
We’ve loaded your transaction monitor dashboard with transaction performance data tiles: Last check overview, monitor log, error charts and tables, and most importantly, step timing graphs and tables (see figure below).
Step timing data
You have three tiles with different views of your step timings: one showing results over time, one showing timing averages over the full reporting period, and the other showing average timings based on the dashboard’s time interval (hourly, daily, weekly, monthly).
Transaction performance over time
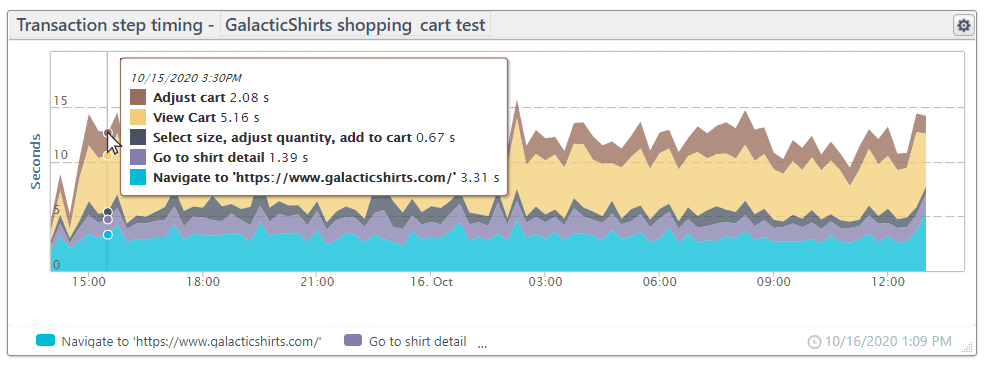
One of the most useful charts for monitoring your transactions is the Transaction step timing chart (see figure below). You get the average timings in a line graph that makes it easy to see changes in individual step performance over time.
Average transaction step time chart
The Average transaction step timing chart shows your step performance averages over the entire reporting period. You quickly see slow step performance (see figure below).

Transaction step timing table
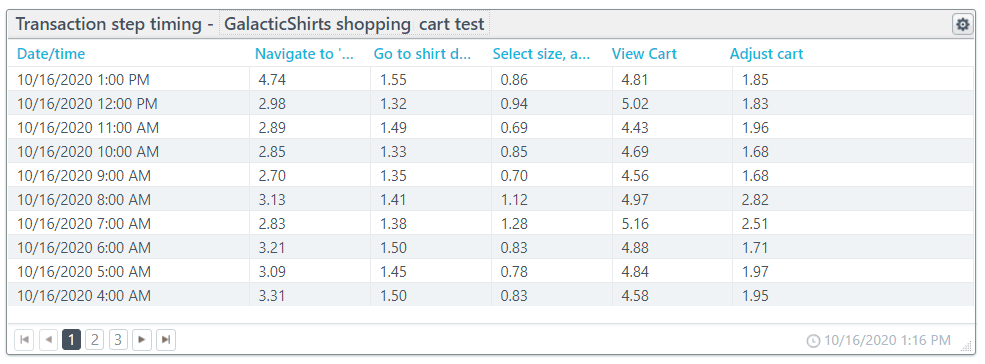
The Transaction step timing table gives your transaction steps’ average performance for the reporting time interval. In the figure below, the table shows average times per hour.
The Transaction Check Detail
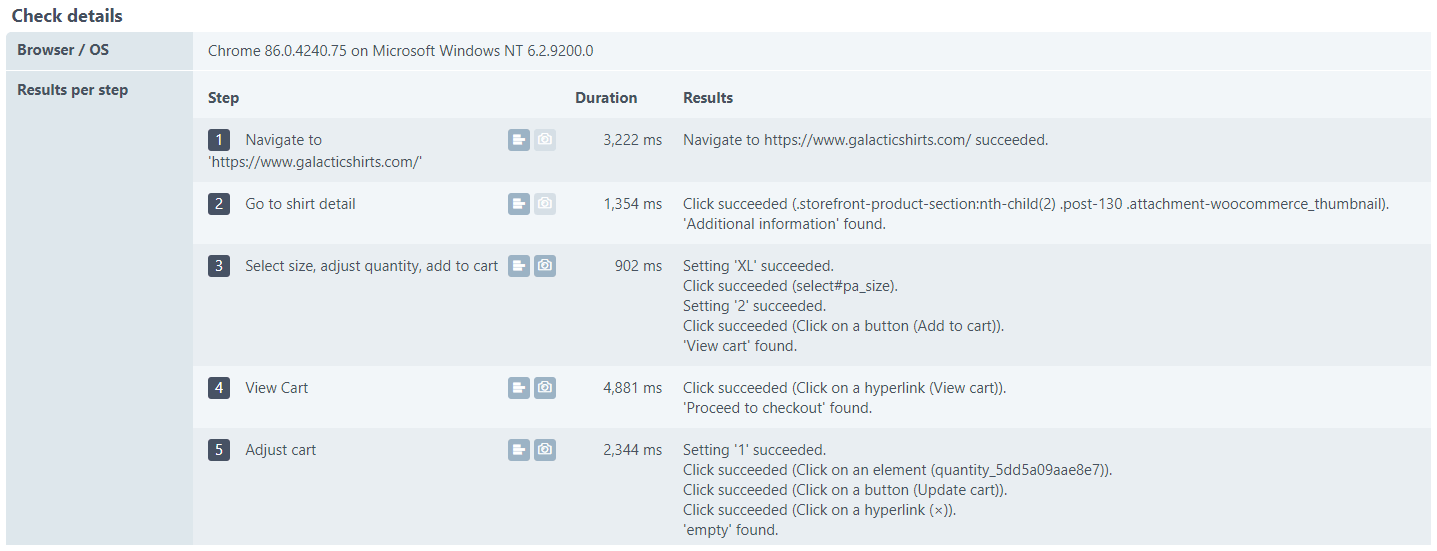
The tiles above give you the pulse of your transactions while the Check Details give you the individual readings. Clicking on the Date/time in your monitor log opens the Check Detail report. Scrolling down in the Check Detail, you’ll find your Results per step. You see the results of every user action, server response, and content check. If you’ve got waterfalls or screenshots enabled for the step, you’ll access those here as well.
A step waterfall report: the heart of transaction performance
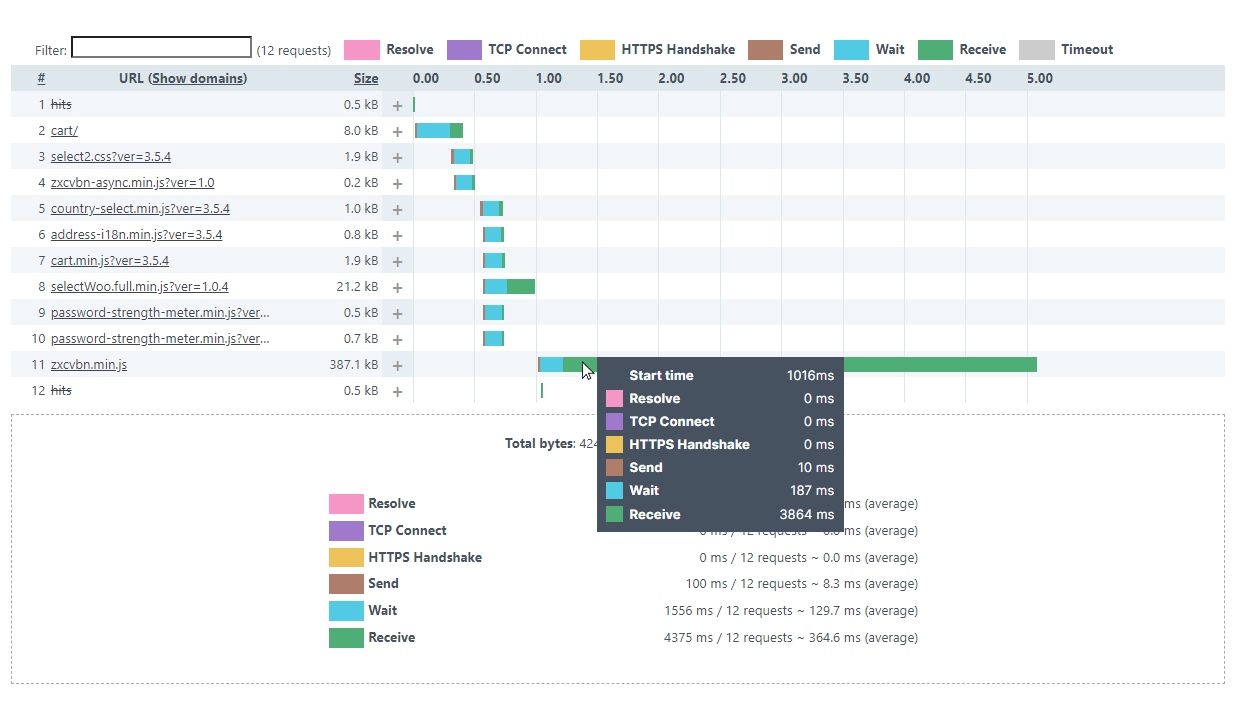
We recommend that you include waterfall reports on all the critical transaction steps. The waterfall below is the result of viewing the shopping cart. You can see that the performance for this step is well beyond the goal of two-second load times. The culprit is a third-party JavaScript file that takes nearly four seconds to receive.
Looking back at our Transaction step timing chart, we see that the problem surfaced within the last 48 hours (see figure below). We could have known about this problem sooner had we made a few changes to the step that would have caused the delay to generate an error.
Get alerts based on step performance
Unless you explicitly set your steps or actions to ignore errors, Uptrends, after error verification, sends an alert whenever an action fails in your transaction. You can set alerts based on total time on the Error conditions tab, but we don’t recommend that you use this feature with web application monitoring because it often leads to needless alerts and some performance problems may still go undetected. Instead, when it comes to transaction performance monitoring, we suggest you use a content check.
Why use content checks for performance alerting?
Whenever you check for document or element content, your web application monitor by default waits up to 30 seconds before generating an error based on the missing content. By adjusting the wait time for the content to appear, you can effectively put an upper limit on the page load time within the step.
Let’s look at an example.
In our GalacticShirt shopping cart test, step four takes the user to view their shopping cart. To verify that the correct page opened, we have a content check that checks the document for the phrase “Proceed to checkout.” So, if the monitor finds the phrase within 30 seconds, Uptrends doesn’t report an error. However, in this case, 30 seconds most likely means a lost sale. To make sure Uptrends informs us that the step has surpassed our desired goal of two seconds, we change the wait timeout.
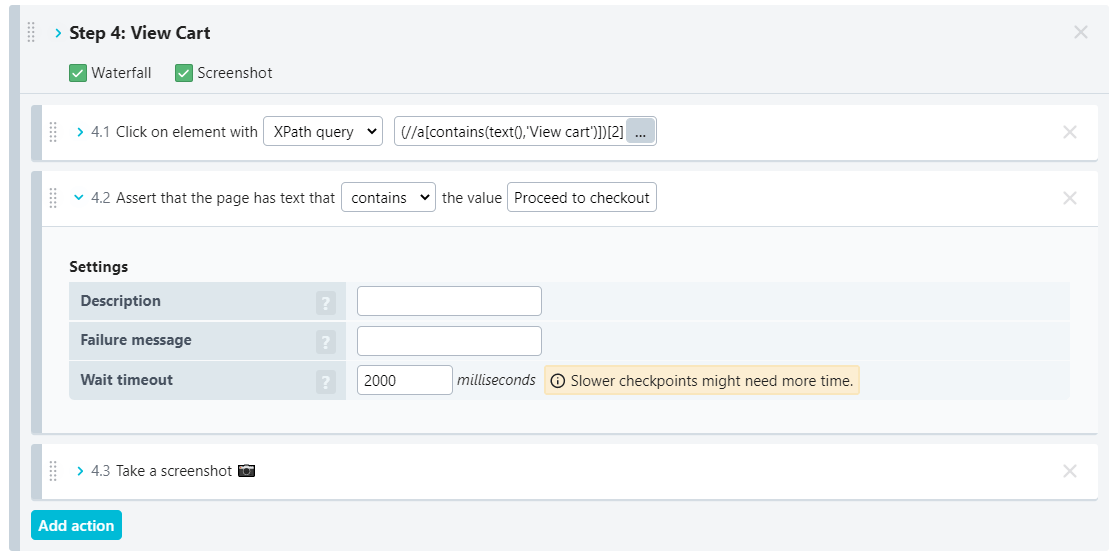
We change the Wait timeout to two seconds. If the content is present before the timeout, the transaction continues. If the monitor doesn’t find the content within the time limit, Uptrends makes another check from a different checkpoint to verify the error before issuing an alert.
Start tracking web application performance with Uptrends
Your users expect every interaction they have with your page to be smooth and error free. Performance problems, such as a slow API call for credit authorization, can erode user trust. Using Uptrends’ Web Application Monitoring, you can test for function and performance at the same time. You stay ahead of issues affecting your users and resolve them before your users start to complain. If you have questions about setting up your web application monitors or you need help with your transaction scripts, our support team is ready to lend you a hand. If you would like to see more, our monitoring consultants will happily give you a one-on-one demo of transaction monitoring in action.