We’ve added a new feature to your monitoring settings, Concurrent Monitoring. Now you can choose to have Uptrends test from multiple locations at the exact same time. Not only will you have more data for your analysis, but you also get your alerts quicker, leading to faster problem resolution.
What is Concurrent Monitoring?
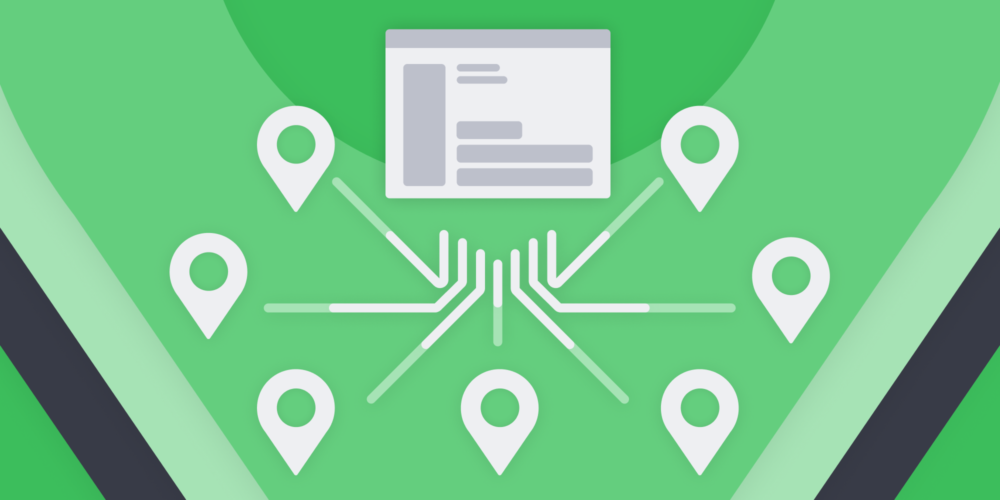
When you enable Concurrent Monitoring for an Uptrends monitor, you choose three or more checkpoint locations from Uptrends’ 220+ checkpoints. Instead of testing from only one checkpoint at a time, your monitor check happens on all your chosen checkpoints simultaneously. If you’ve chosen five checkpoints and set your test interval to one minute, your monitor makes 300 tests an hour.
The advantages of Concurrent Monitoring
The main advantages of Concurrent Monitoring are more data and faster error detection.
Concurrent Monitoring = more data
As illustrated earlier, a single uptime monitor with five checkpoints can generate 300 tests per hour. A standard monitor (a single checkpoint monitor) can generate at most 60 checks an hour.
If the metric you’re tracking is for performance, you get a much better view of your performance with 60 tests vs. 12. More data simply means better data. You have a more complete view of your web assets.
Concurrent Monitoring = faster alerting
When your standard monitor encounters an error, Uptrends records the error as unconfirmed. To confirm the error, Uptrends schedules the test again immediately. If the monitor gets a second error, Uptrends records the error as confirmed and issues an alert. Depending on the monitor type, the elapsed time from unconfirmed to confirmed can take a minute or more (some transaction monitors take nearly four minutes to complete). If the problem is intermittent or localized, a second test may succeed. You see the unconfirmed errors in your reporting, but no alerts go out. Concurrent Monitoring fixes that.
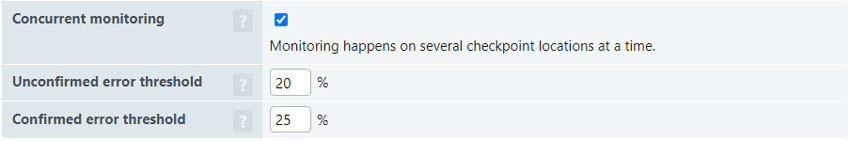
When you set up your Concurrent Monitoring, Uptrends defines confirmed and unconfirmed errors as the percentage of errors returned.
Let’s look at a quick example.
Your monitor uses ten checkpoints, and you have your unconfirmed error rate set to 20% and confirmed error threshold level set to a 25% failure rate.
- If one check fails (10% failure), Uptrends records an okay because the number of errors does not meet the unconfirmed threshold of 20%.
- If two checks fail (20% failure), the number of errors meets the 20% unconfirmed error threshold, and Uptrends records an unconfirmed error.
- If three checkpoints error (30% failure rate), the confirmed error threshold is surpassed, and an alert goes out immediately.
Using the error thresholds, you can track issues without unwanted alerts, and large scale outages send out an alert immediately without waiting for the confirmation check.
See more examples and learn more about error thresholds.
Choose your checkpoints
Your checkpoint selection options depend on the number of checkpoints you choose. If you choose only three checkpoints, you’re limited to what’s called “High Availability” checkpoints (more on that in a moment). If you opt to use a minimum of five checkpoints, you may choose from any of Uptrends checkpoints for your Concurrent Monitoring.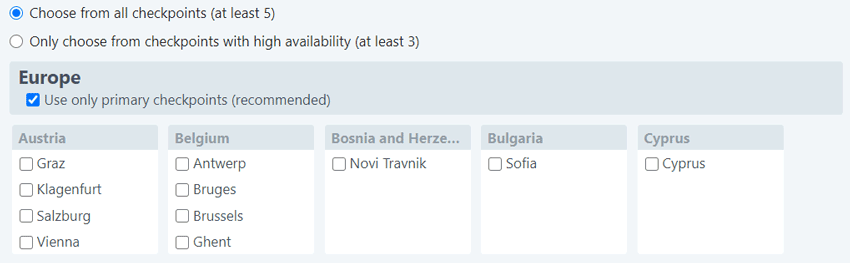
What are high availability checkpoints?
High availability checkpoints are simply Uptrends checkpoint locations that have two or more servers. For example, our New York checkpoint has two servers working behind the scenes conducting the monitoring checks. During checkpoint maintenance, we have to take servers offline for a short period. If a checkpoint has only a single server, the checkpoint is not available to conduct your testing during maintenance. When you select high availability checkpoints, the servers don’t all come down at once, so the checkpoint continues to conduct tests, and your monitoring continues without interruption.
Concurrent Monitoring and your reports
We’ve made several changes in your logs and Check Details reports to accommodate Concurrent Monitoring.
Monitor Logs
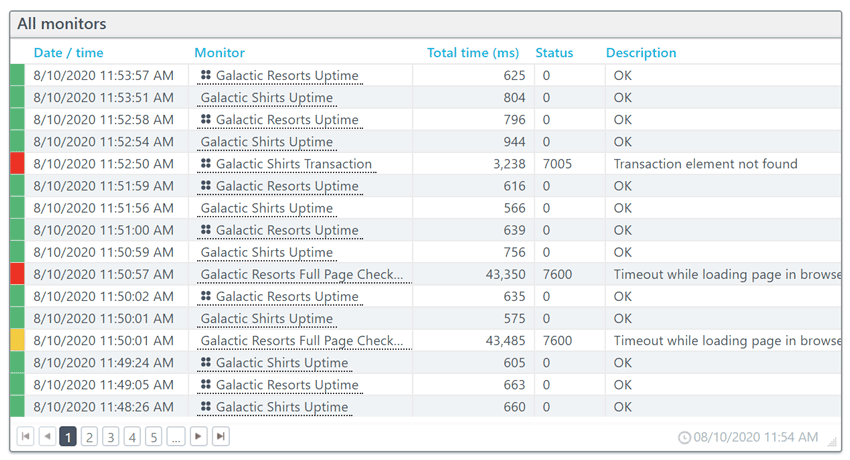
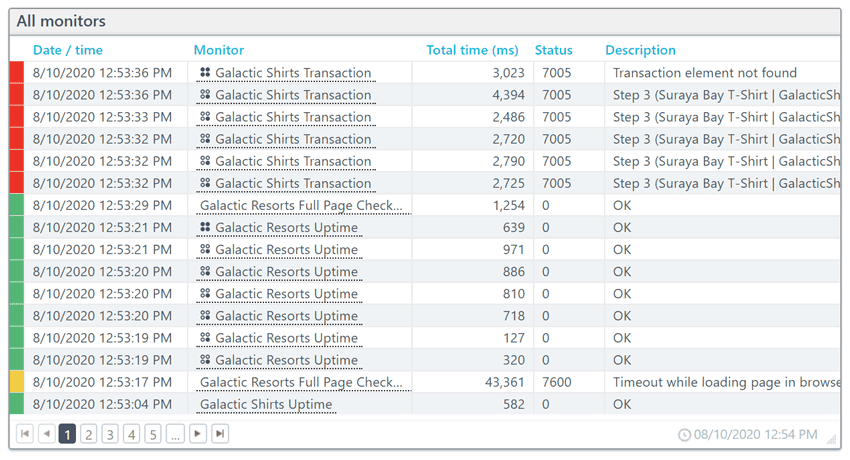
Your Concurrent Monitoring checks appear in your monitor logs alongside your standard monitoring checks. Your concurrent checks appear with a four-dot icon before the name. The check with the four black dots represents the entire group of checks (called the overall check) showing averaged data based on the different checks conducted concurrently (see figure below).
Note: Waterfall data is not aggregated and averaged in the overall Check Details report.
You can include the contributing individual checks on a dashboard level or individual tiles.
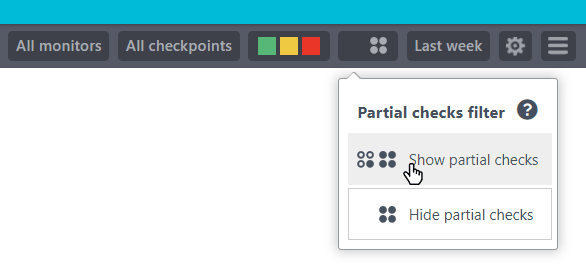
Apply Show partial checks to the entire dashboard.
- Click the Partial checks filter option on the Quick Action Menu.
- Click to choose Show partial checks (see below).
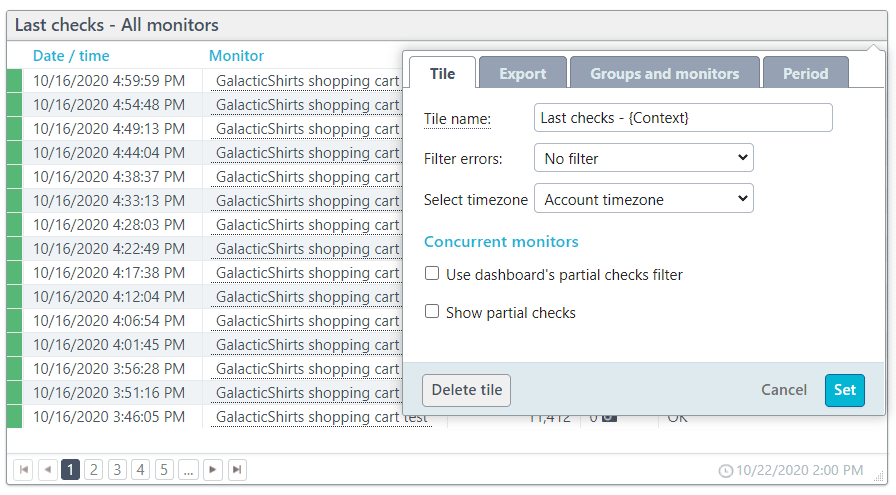
Apply Show partial checks to individual tiles.
- Click the gear icon at the top-right corner of the monitor log tile.
- Click to deselect Use dashboard’s partial checks filter box if checked.
- Check the Show partial checks box on the Tile tab.
- Click Set (see figure below).
The individual checks that comprise the monitor now show in your monitor log. They also include the four-dot icon, but they only have one solid black dot (see figure below).
Concurrent Monitor Dashboard
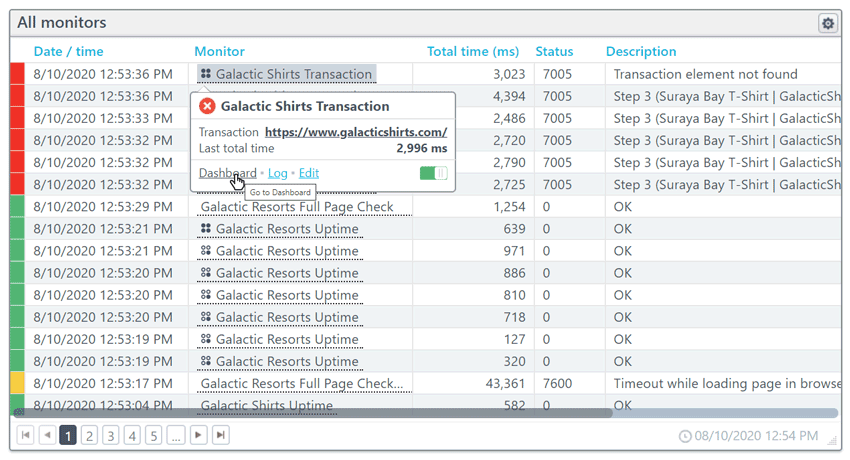
From your monitor logs, you can access the dashboard for a particular monitor by hovering over the monitor’s name and selecting Dashboard from the fly-out options (see figure below).
 We’ve developed a default dashboard that includes the Multicheckpoint Chart tile. The chart includes your data for each checkpoint over time. The figure below shows the total time for a span of about three hours for five checkpoints. The tile can display up to ten checkpoints. Likewise, the Multicheckpoint List title gives you your metrics on a per-checkpoint basis.
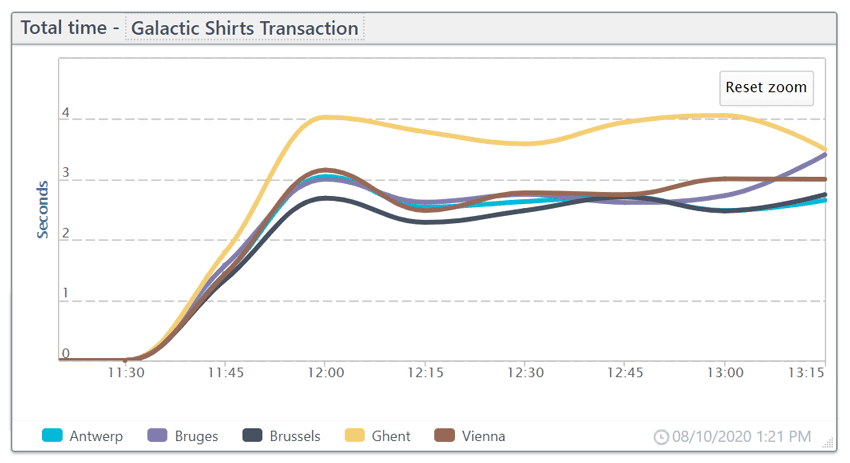
Check Details
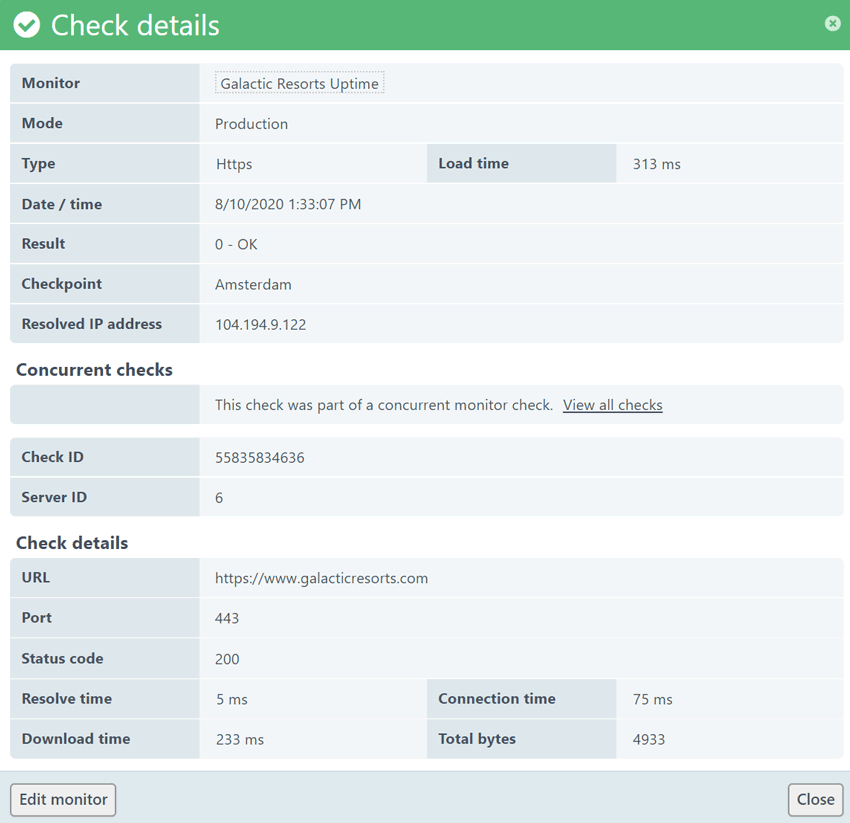
When you click the date for a Concurrent Monitoring check in your monitor logs, you get the Check Details report for that instance of the check. If you click the overall check (four black dot icon), you see the averaged details and the results per check. In the uptime monitor check shown below, you can see each result in the Concurrent checks section.
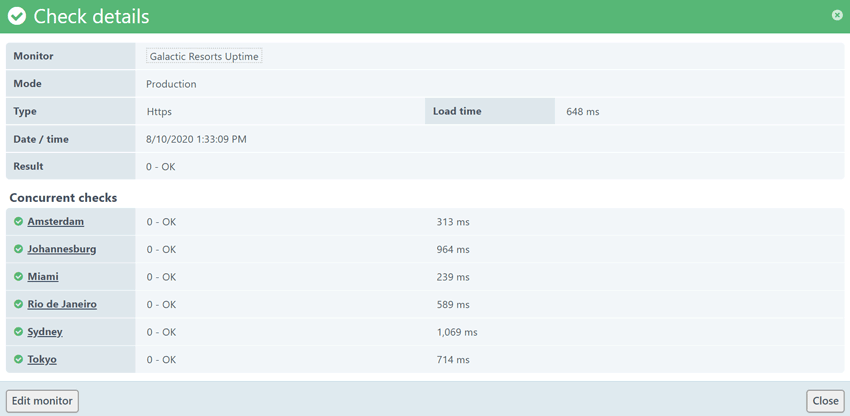
Clicking on the checkpoint name in the Concurrent checks section brings up a detailed view of that specific check (see figure below). You can use the View all checks link under Concurrent checks (see figure below) to return to the overall report.
Learn more about Concurrent Monitoring reporting in our Knowledge Base.
Support for Concurrent Monitoring in Uptrends’ API
We’ve added new fields to your Monitor API and the MonitorCheck API. Check the API documentation to review the new API additions for Concurrent Monitoring.
Concurrent Monitoring pricing
We’ve based the cost of Concurrent Monitoring on the type of monitor and the number of checkpoints selected. We have several examples below, but your monitoring consultant can always help you out with understanding pricing as well.
Examples
- One HTTPS uptime monitor uses one monitor credit for a standard monitor. When you switch the monitor to concurrent with five checkpoints, the new concurrent monitor uses five monitoring credits.
- One Full Page Check monitor uses one browser monitor credit for a standard monitor. Switching that same monitor to concurrent with five checkpoints, the monitor uses five browser monitor credits.
- One transaction monitor uses five transaction credits as a standard monitor. As a concurrent monitor with three checkpoints, the monitor uses 15 transaction credits.
- One Multi-Step API monitor has three steps and uses three API monitor credits as a standard monitor. As a concurrent monitor with six checkpoints, the monitor uses 18 API monitor credits.
Get more pricing information in our Knowledge base.
Want to learn more?
Your monitoring consultant can help you out with any additional questions you may have. Or you can schedule a demo for a one-on-one virtual meeting. We have Knowledge Base articles to help you out, and our Support team is always ready to answer your questions too. Start using Concurrent Monitoring today!