Our Real User Monitoring (RUM) product gathers performance data from actual user experiences from all around the globe for enabled pages. For 2018 that meant we collected data from thousands of worldwide users. In this blog, we take a look at the users’ browser choices, the page performance as experienced by the users, and their choices in device types.
Data collection
Users access content with an assorted combination of devices, browsers and browser versions, and operating systems and their versions from locations everywhere around the world. Using Real User Monitoring, a content or service provider can gather the performance information directly from each user. Examining the aggregated data tells you a lot about your site’s users’ environments, and how they experienced your site.
From a much higher perspective, Uptrends can take the data collected from all those RUM enabled websites and see how users experience the web in general. We’ve collected the data, stripped away any identifying information about the users and the pages they accessed, and we’ve laid it out for you.
Device type and browser market shares
Mobile and alternative devices are quickly replacing the desktop for accessing web content. For 2018 we saw almost a fifty-fifty split between the two with Desktop only taking 48.77% share, and tablets and smartphones taking 51.17% (See Figure 1 or Table 1). At less than a 1.00% share, the other category includes game consoles, smart watches, e-readers, and televisions.
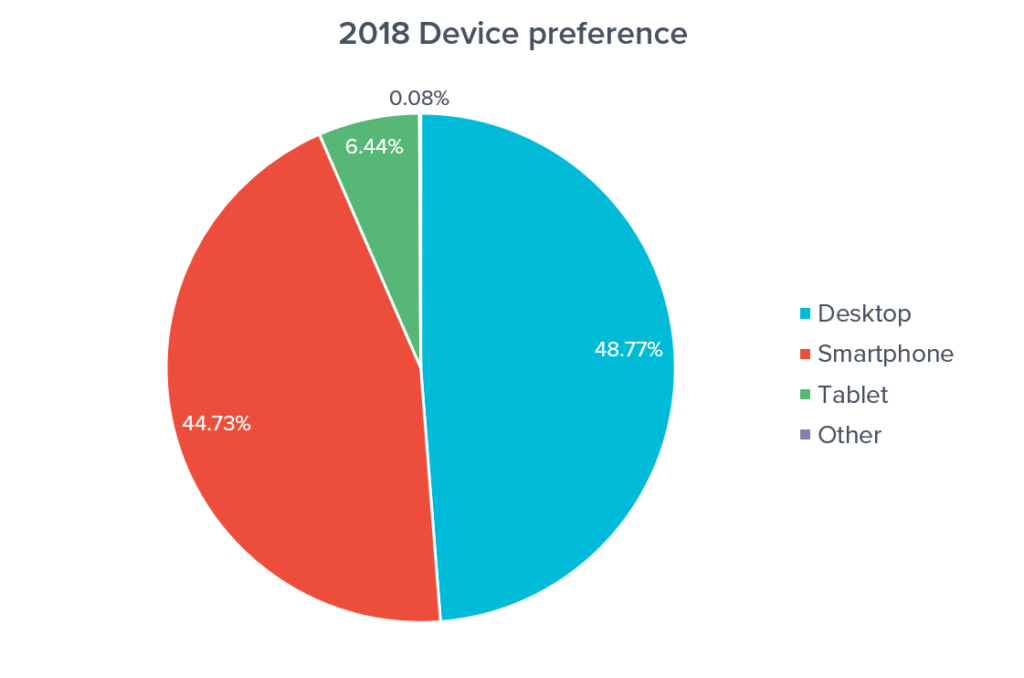
Table 1: Device type market share 2018
| Device type | Market share |
|---|---|
| Desktop | 48.77% |
| Smartphone | 44.73% |
| Tablet | 6.44% |
| Other | 0.08% |
For all devices and all versions, Chrome is still the browser of choice by most users, Safari comes in at second, and Firefox and Internet Explorer fight it out for third place (see Figure 2 or Table 2).
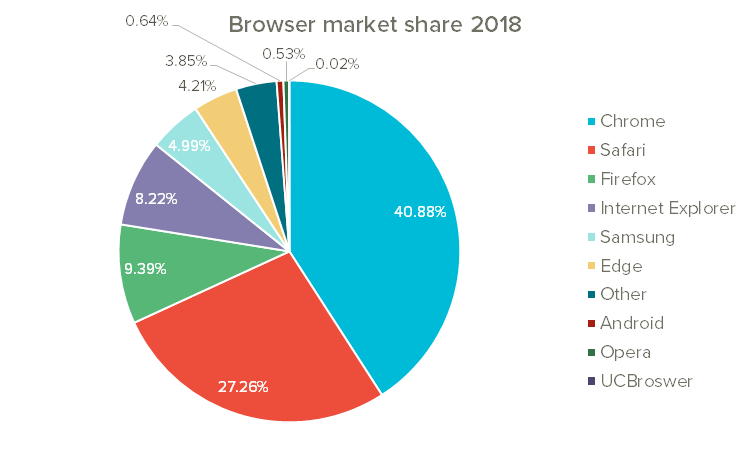
Table 2: Browser market share 2018
| Browser | Market share |
|---|---|
| Chrome | 40.88% |
| Safari | 27.26% |
| Firefox | 9.39% |
| Internet Explorer | 8.22% |
| Samsung | 4.99% |
| Edge | 4.21% |
| Other | 3.85% |
| Android | 0.64% |
| Opera | 0.53% |
| UCBrowser | 0.02% |
Web performance by device type and browser
So many factors influence the performance of any webpage such as device type, operating system and version, browser choice, and connection speed. You can get a pretty good benchmark based on the aggregated experience of users accessing your content from those environments. The following takes a look at performance based on the browser and device type.
Best performance by device type
When it comes to performance based on the device type, you won’t find any surprises. On average desktops have the fastest load times at approximately five seconds with smartphones falling in behind with two- and three-seconds additional load time respectively (See Figure 3 or Table 3).
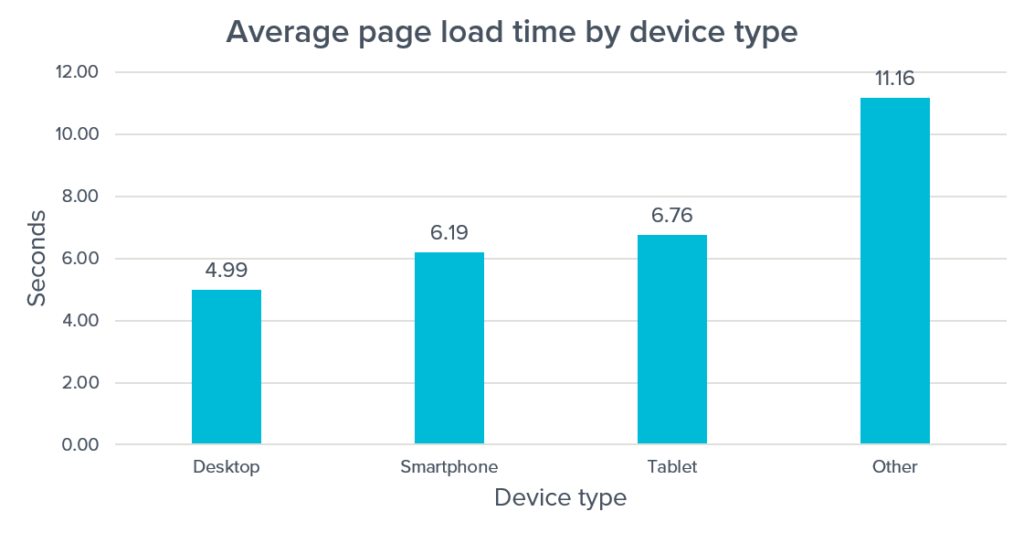
Table 3: Average page load time by device type 2018
| Device | Average page load time (s) |
|---|---|
| Desktop | 4.99 |
| Smartphone | 6.19 |
| Tablet | 6.76 |
| Other | 11.16 |
Best performing browsers all versions
Of course, you will find many different reports rating browsers with most based on a combination of factors such as speed, ease of use, and features. That being the case, it is no wonder that Chrome remains the number one choice among users, but it isn’t the fastest browser based on the users’ experiences with our RUM enabled pages. Based on our RUM data, Chrome sinks to sixth place with Safari taking the lead with average load times of 5.89 seconds (See Figure 4 or Table 4).
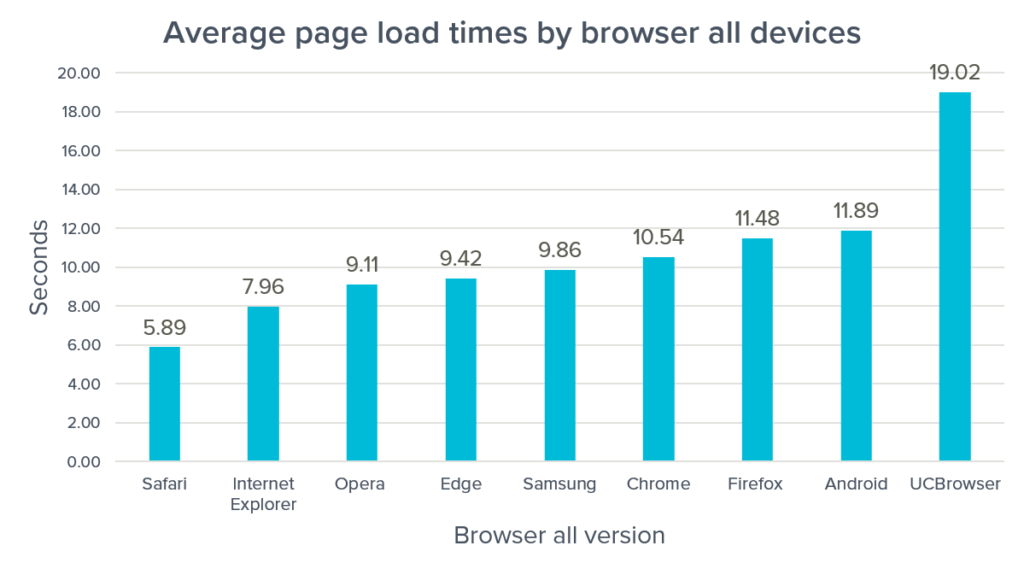
Table 4: Average page load times by browser all devices
| Browser | Average load time (s) |
|---|---|
| Safari | 5.89 |
| Internet Explorer | 7.96 |
| Opera | 9.11 |
| Edge | 9.42 |
| Samsung | 9.86 |
| Chrome | 10.54 |
| Firefox | 11.48 |
| Android | 11.89 |
| UCBrowser | 19.02 |
The data above includes desktop, mobile, and tablet versions of all the browsers, so it is no surprise that the Android and UCBrowser finish dead last. To get a more meaningful comparison, let’s break out the performance data based on device type.
Browser Performance by device type
Typically, desktop browsers have the advantage of faster networks and more computing power, but delivering responsive content based on the device can mitigate the differences users experience on smartphones and tablets. So, how do the browsers compare based on Device?
Desktop browser performance
When it comes to desktop browser performance, our RUM data shows that the popular Chrome browser doesn’t compare to Safari. Our RUM enabled pages loaded 63% faster on Safari than on Chrome, and Safari beat out its nearest competitor, Internet Explorer, by being 5.62% faster (See Figure 5 or Table 5).
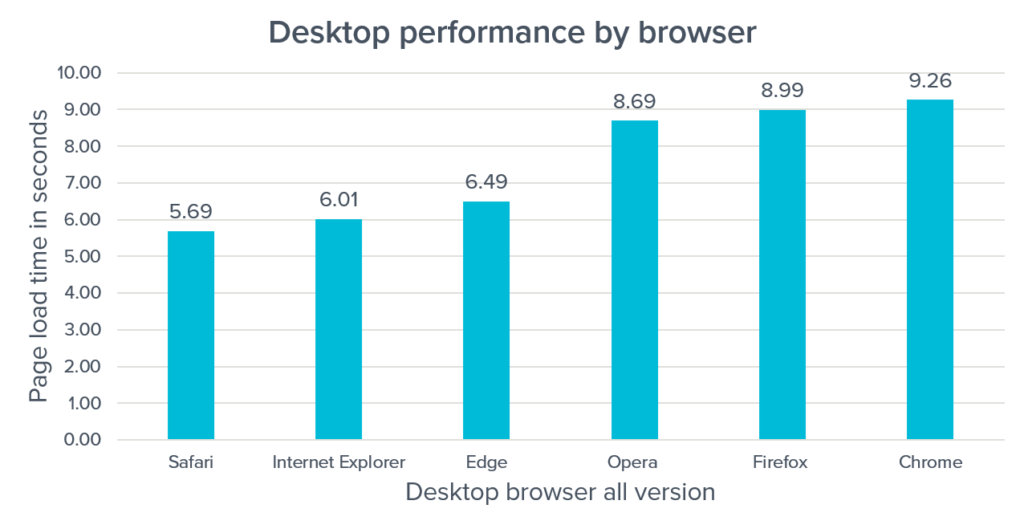
Table 5: Average desktop page load times by browser
| Browser | Average load time (s) |
|---|---|
| Safari | 5.69 |
| Internet Explorer | 6.01 |
| Edge | 6.49 |
| Opera | 8.69 |
| Firefox | 8.99 |
| Chrome | 9.26 |
Smartphone browser performance
When it comes to smartphones, so many factors come into play including operating system, Wi-Fi versus wireless network, and manufacturer. From our RUM data, we observe that Safari wins the prize again for top performance while the UCBrowser does poorly with 223% slower speed than Safari (See Figure 6 or Table 6).
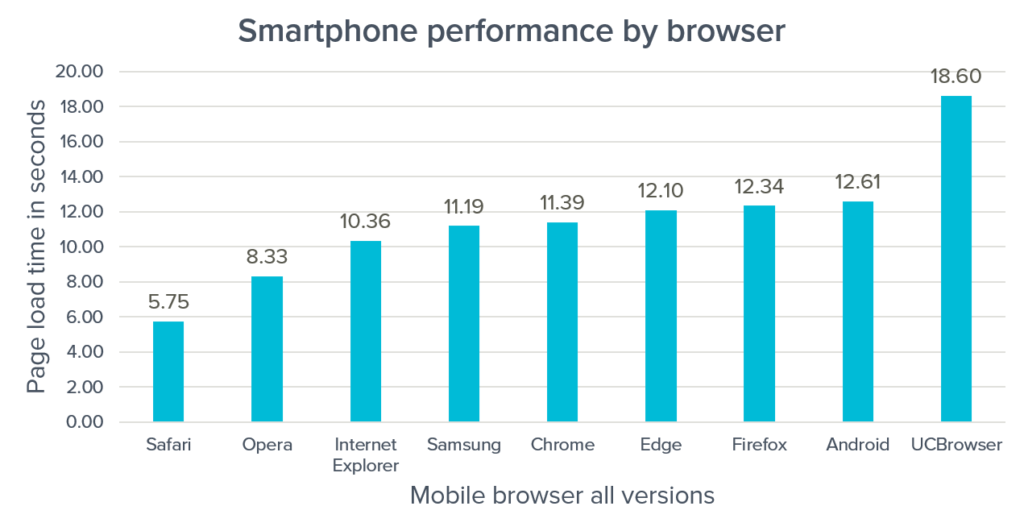
Table 6: Average page load times by browser on smartphones
| Browser | Average load time (s) |
|---|---|
| Safari | 5.75 |
| Opera | 8.33 |
| Internet Explorer | 10.36 |
| Samsung | 11.19 |
| Chrome | 11.39 |
| Edge | 12.10 |
| Firefox | 12.34 |
| Android | 12.61 |
| UCBrowser | 18.60 |
Tablet browser performance
Tablets have more screen real estate and better resolution than smartphones, so they tend to receive more data than a smartphone. Nothing travels better than a pocketable smartphone, so tablets tend to stay home where they benefit from faster broadband connections mitigating the larger page size with faster connections. Safari still comes out on top, but it didn’t perform as well for tablets as it did for smartphones. Internet Explorer did much better with tablets than it did for smartphones with a 37% increase in page speed. UCbrowser still finishes at the bottom at 19.43 seconds (See Figure 7 or Table 7)
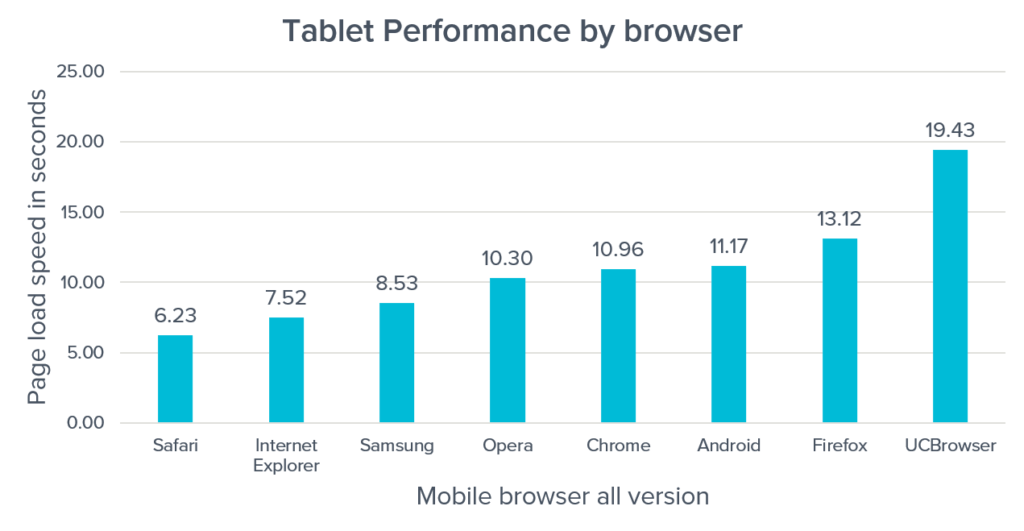
Table 7: Average page load times by browser on tablets
| Browser | Average load time (s) |
|---|---|
| Safari | 6.23 |
| Internet Explorer | 7.52 |
| Samsung | 8.53 |
| Opera | 10.30 |
| Chrome | 10.96 |
| Android | 11.17 |
| Firefox | 13.12 |
| UCBrowser | 19.43 |
What about your users’ experiences?
We’ve taken the data for this report from our first full year of gathering RUM data. RUM gives actionable data on how a RUM enabled website’s actual users experience a site in nearly real time. The data is gathered from each page loaded and aggregated with the data from other users. RUM lets you sort your data based on location, device type, operating systems and their versions, and browsers and their versions. You can make sure that every user despite their environment has the best experience possible when interacting with your site or service.
Knowing how your users experience your site using Real User Monitoring allows you to fine-tune your synthetic testing to closely resemble your users’ environments for a proactive approach to site management. Try RUM for 30 days; just click the “Try Real User Monitoring!” Button above the main menu in your Uptrends account or sign up for a free one-on-one demo.


Leave a Reply