
When was the last time you checked your website’s performance? If your answer is longer than five minutes ago, you’re dropping the ball on one of the most important things you can do to improve bounce rates, Google rankings, conversions, and revenue. In this article, we go over the steps you need to take when maintaining a fast user experience.
Why does website performance matter?
No matter how much effort and time you’ve spent developing your user interface, generating killer content, marketing your site, or how amazing your products, if your website is slow, you’re hurting your business. Users start making decisions about your site the moment they click a link. Research has shown that a 500-millisecond slowdown in page speed is enough to sway peoples’ opinions. A slow-loading page affects users in many ways as described by Tammy Everts in her book Time is Money: the Business Value of Web Performance.
- Slow websites reduce confidence in a brand.
- Slow loading pages foster a negative perception of the user interface (UI) and the services and products offered.
- Slow and clunky checkouts diminish trust and increase abandonment rates.
- Bounce rates go up. At 3 seconds, 45% of users have already moved on to a competitor.
- User retention goes down.
- Revenue suffers as conversions drop and cart size decreases.
- Page speed affects SEO.
As you can see, maintaining fast loading pages is every bit as important as every other aspect of your business and website; unfortunately, many brands give performance a lower priority, and their business suffers as a result.
Why does website speed slip over time?
Hopefully, you started with a performant website. You established a performance budget and stuck to it, but now you’re finding that your performance has slipped. You’re not alone. Many web professionals have found themselves in the same boat. Let’s look at a few of the reasons your website’s performance may degrade over time.
- Introduction of unoptimized images, CSS, and Script files
- Addition of images, script, and CSS files (new or expanded) that exceed the size and quantity outlined in the performance budget.
- Excessive requests. Every element requires a new request from the server eating up time.
- Web hosting plan. You may have reached the maximum load your plan can handle, other sites on a shared hosting plan eat up available bandwidth, or you need to add additional servers to accommodate the load.
- Aging infrastructure. Your web servers and supporting hardware slow due to wear or can’t handle the growing traffic.
- Third-party content consumes more bandwidth and processing time than expected.
- Browsers change over time. Changes may result in slower load times for your site, so you need to adjust for shifting browser performance as they happen.
The truth is that there are plenty of reasons website performance slips, and the most experienced web development professionals find themselves struggling with maintaining a fast website.
Build a web performance culture
One of the first steps to maintaining a fast website is to get the entire company involved in making performance a priority.
A Fast web for every user
As workers in the technology field, we tend to use and design for the latest technology. In the rush to adopt the latest and greatest devices and development practices, we may forget that many of our users don’t have access to fast devices and networks. Designing for and testing for users on a variety of devices, connections, and browsers just makes sense.
Get yourself, and the people working on your project, an old device. Simulate bad network conditions and slow CPUs and make your project resilient. Figure out what devices users own and be careful prioritizing based on what devices users use on your site.
Design with performance in mind for now and for the future
Every decision made regarding the website or app should come from a performance perspective. How will this new feature affect the site’s performance? You need to test each new technique, API, and library to see how it affects performance before finding its way into the website’s build.
Get everyone on board
A focus on performance takes commitment and time. Building a case for and getting approval of all stakeholders allows you to make the sacrifices that a commitment to performance may take. Educate the team on the technology and decisions made for performance, and challenge teams to seek new performance enhancements for testing.
Make performance testing part of your CI/CD workflow
Integrating performance into your CI/CD (Continuous Integration/Continuous Delivery) processes means that automated processes monitor your development and acceptance environments to capture any performance-related issues before development moves on to new projects. Once a developer checks in a change, the code repository kicks off a new build, and performance monitors start testing as soon as the build is complete. If there is a problem, the monitor notifies the team at once. You can automate your monitoring updates, and if you have a Private Checkpoint, you can put Uptrends to work monitoring your development and acceptance environments. Learn more about integrating Uptrends into your CI/CD Process.
Establish a website performance budget
Just like paying your bills, you’ve allocated so much money each month to housing, transportation, entertainment, and miscellaneous expenses. When the money runs out, you stop spending, and you may have to shift some cash between expenses to make it all work. Your website is no different. Establish a maximum load time and stick to it. No matter what.
In doing so, you need to take a close look at your line items.
- Network duration: DNS resolve, connection time, redirection time
- Backend: Receive and send durations
- Load time: Time to first byte and page ready time
- Frontend: DOM and render durations
- Download time
You need to consider the above list for every page element. Trips to the server are expensive, so minimizing the number of requests can go a long way towards improving performance. You can also reduce trips by combining your script files or CSS files into single files. Include the critical script and CSS for the above the fold content in the header and lazy-load the rest (Learn how to load CSS without blocking rendering).
You have a large performance toolbox:
- Use content delivery networks (CDNs) to reduce network latency.
- Use browser hints: preload, prefetch, and preconnect.
- Use Service workers.
- Enable compression.
- Optimize images and use image sprites when possible.
- Remove obsolete CSS and code to reduce file sizes.
- Utilize browser cache and set longer timeouts.
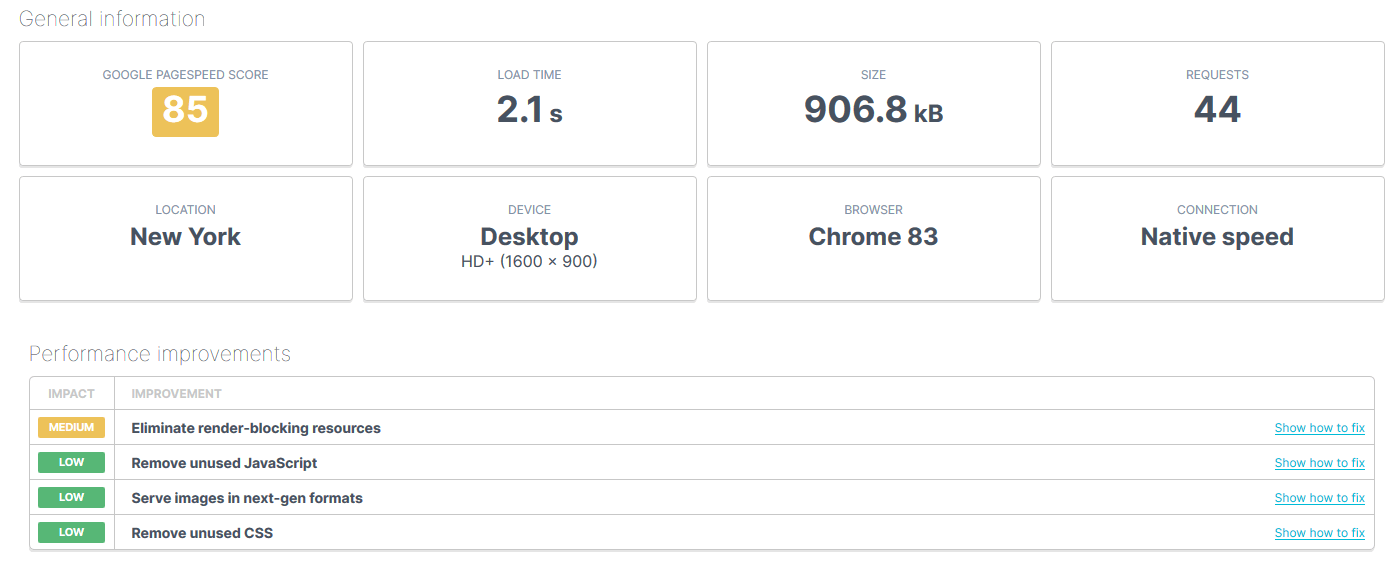
If you need to know where to start your website optimizations, our free Website Speed Test tool can give you your PageSpeed Insights score and optimization recommendations. You have lots of options to help you get your website in budget, but keeping a website fast requires continued maintenance.
Watch your website speed
The slightest change in the code, the network infrastructure, or content can cause your website to slow down suddenly. To keep an eye on your website speed, you need synthetic Web Performance Monitoring. Uptrends’ Full Page Check (FPC) lets you simulate real-world experiences by
- Using a current browser: Firefox, Chrome, or Internet Explorer.
- Allowing you to simulate different devices and screen sizes.
- Throttling connections to simulate different connection types.
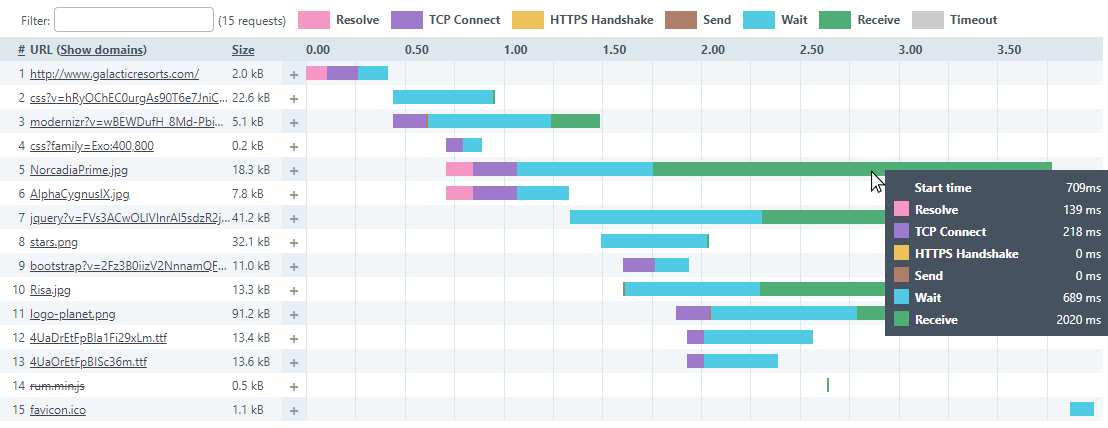
The FPC measures every request and records the DNS resolution, connect, handshake, send, wait, and receive times. The FPC puts the results into a handy waterfall chart where you can quickly see failing elements, bottlenecks, and other element-specific issues such as sluggish third-party responses.
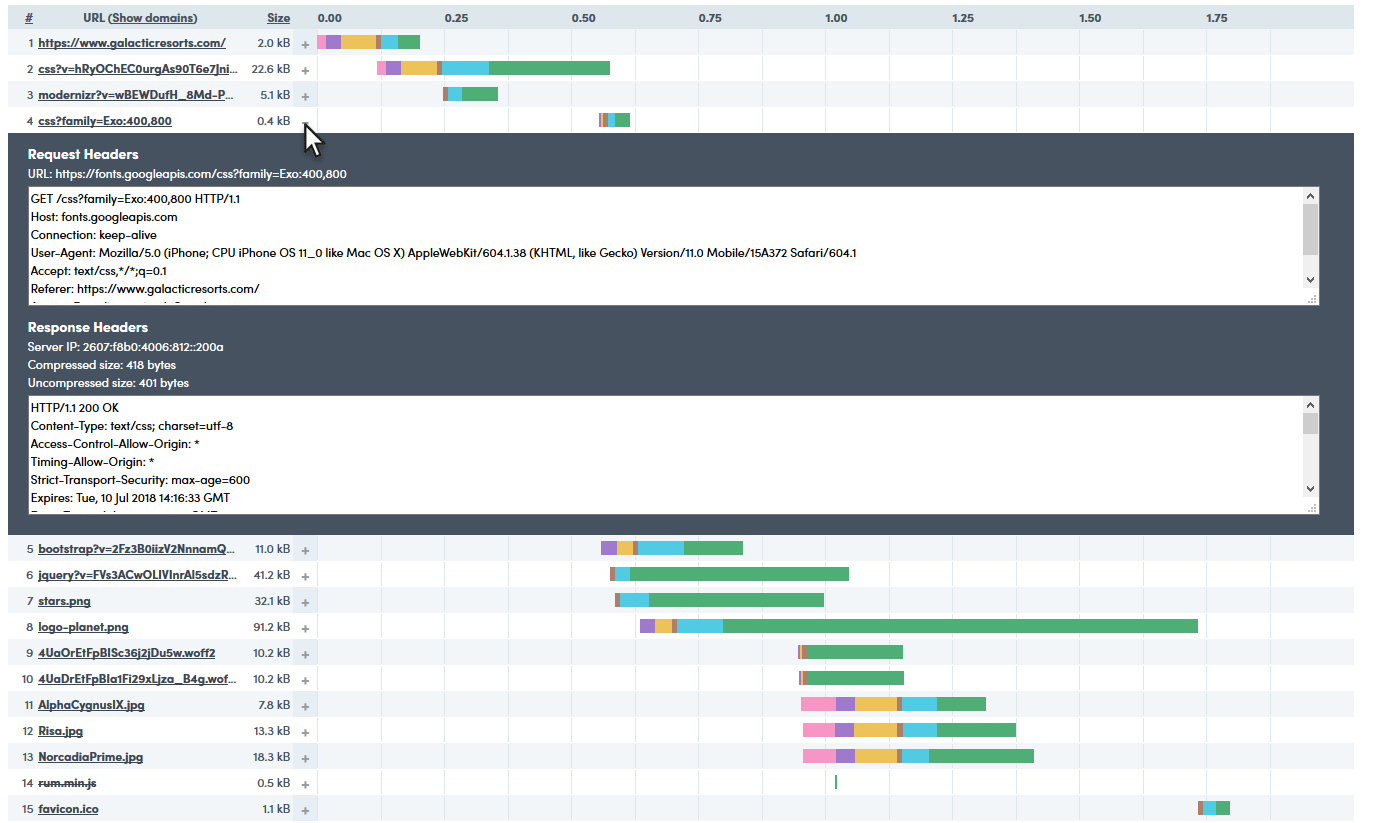
You can view the details of each request and response header.
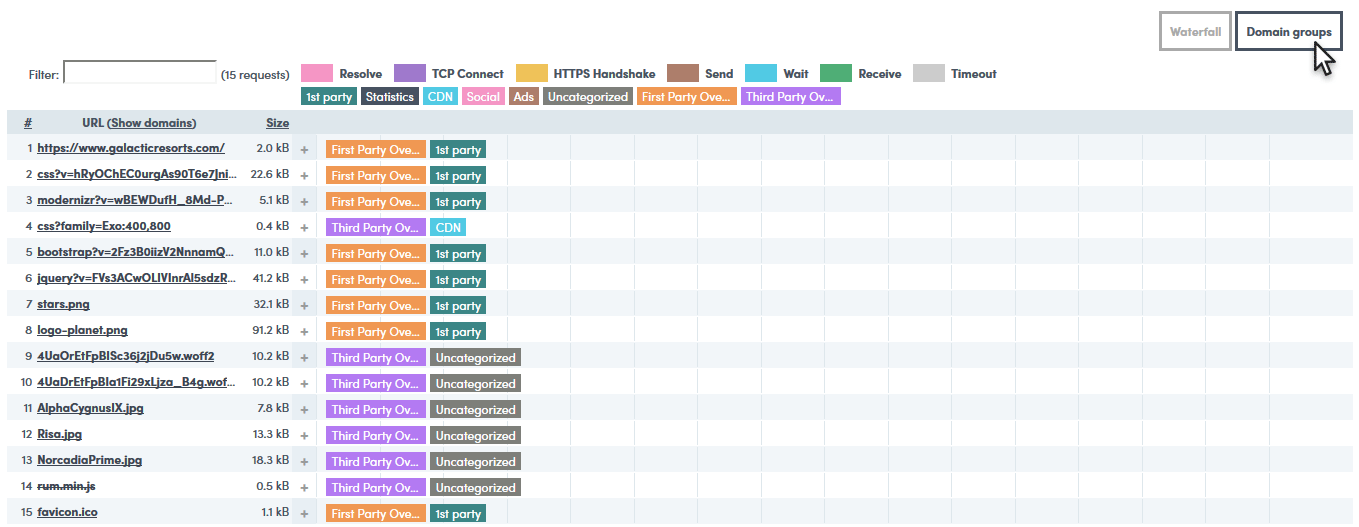
If you choose to enhance the FPC (Full Page Check +), you can also see your content broken down based on domain. You can quickly see performance broken out based on your third-party content, CDN response, and your servers’ speeds.
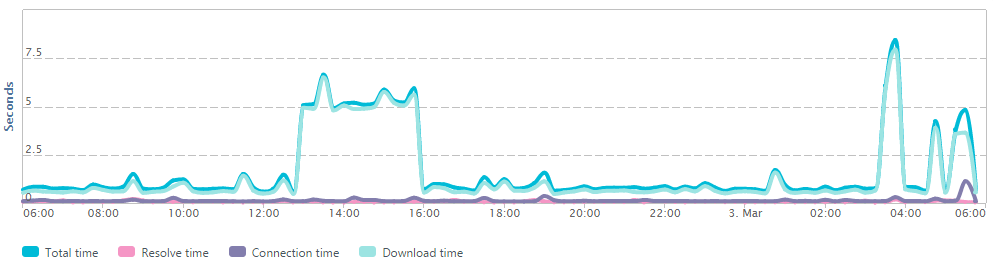
Uptrends Full Page Check allows you to see how your performance changes over time, and you can easily spot performance spikes and trends. You can forestall bigger issues such as failing servers, and you can see the effects of other systems running in the background, such as nightly database updates.
Track your visitors’ experience using Real User Monitoring (RUM)
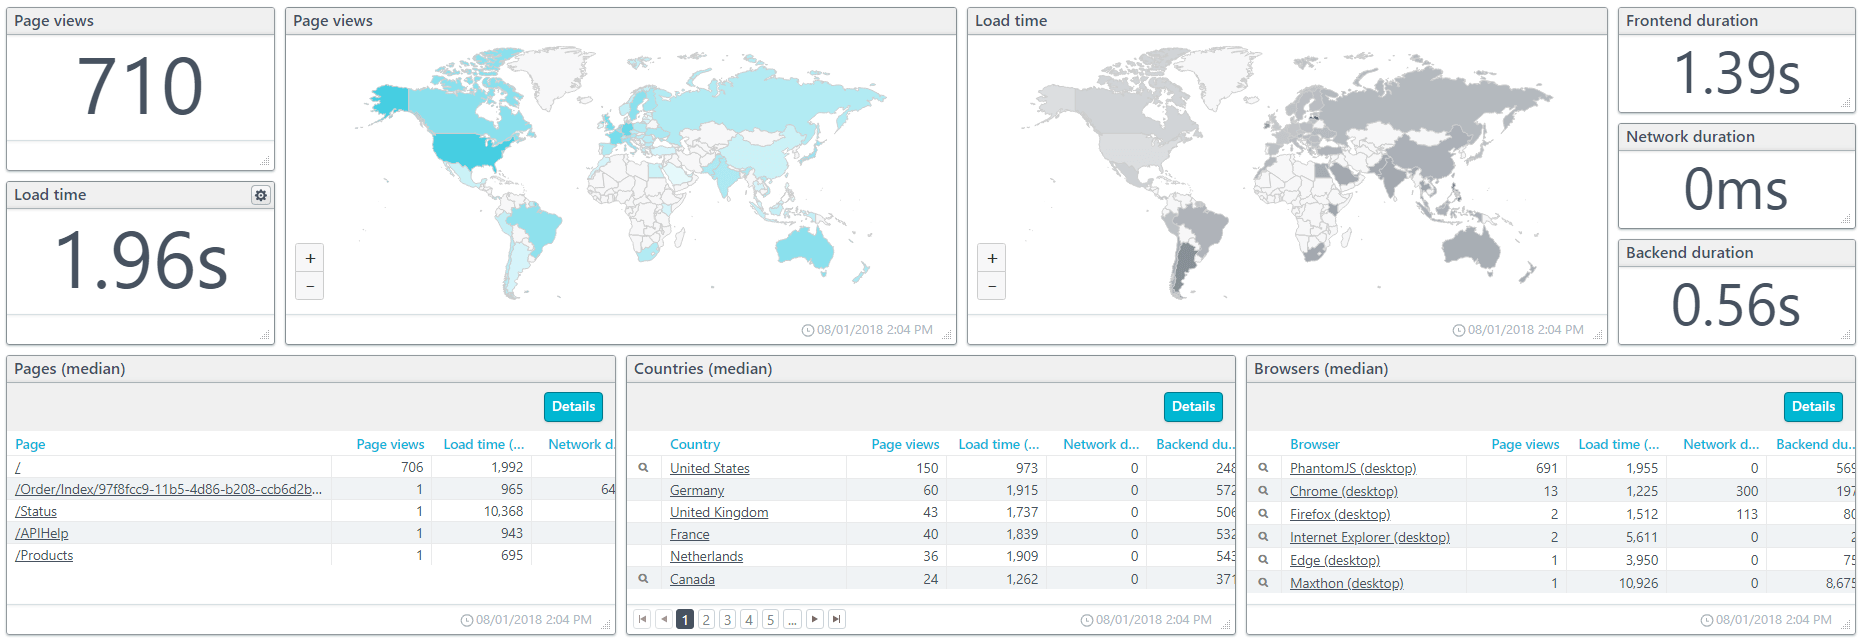
A tiny script file in the header of your pages allows Uptrends to gather user environment information and page-load metrics as they visit your site. Uptrends aggregates the data and lets you see metrics such as download time, time to first byte (TTFB), and page ready time. You can get your metrics based on user location, device type, operating system, browser type, and page viewed. Your RUM dashboards make it easy to access your actual user experience. Learn more about RUM.
Conclusion
Maintaining your website performance takes diligence. You have to design for performance, plan for future enhancements, and employ new speed-enhancing tools and techniques as they become available, and you have to watch your performance metrics at all times. Uptrends has the tools to help you monitor your site performance starting in development all the way through to production. If your performance slips, Uptrends’ dynamic alerting gets the message out.
We also have the tools for you to verify the speed of your APIs and web applications too. Multi-step API Monitoring and Web Application Monitoring give you performance data on each request and the complete interaction. If you would like to try Uptrends for yourself, we offer a 30-day, no commitment, free trial. Sign up for your trial today!