
Have you been looking for a WebPagetest alternative for your periodic synthetic user experience testing? Uptrends has the free tools you need to check your websites.
We love WebPagetest. Although recently procured and no longer independent, WebPagetest has been providing its free open-sourced testing service since 2008 (almost as long as Uptrends). The testing tool has helped many web professionals identify and fix performance issues, but you have other options as well.
Uptrends’ goal is to help make the Internet a better place, and we thank WebPagetest for assisting in that mission. However, Uptrends also has a suite of free tools that let you check your website’s availability and speed, plus a lot more.
Website Speed Test and mobile website speed test
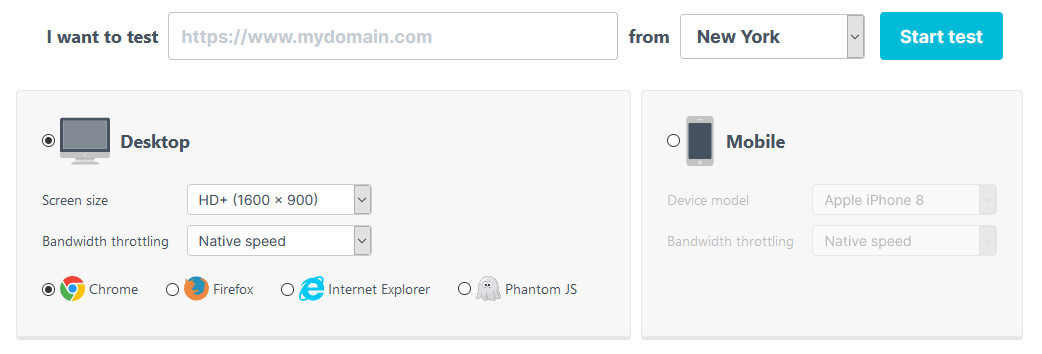
Uptrends’ Free Website Speed Test loads your web page in a browser:
- Chrome
- Firefox
- Internet Explorer
- Phantom JS
You can test either desktop speeds or mobile speeds, and you can simulate different user scenarios by
- Adjusting screen size
- Throttling bandwidth
- Choosing a preconfigured mobile device
- Selecting from 11 globally located test locations (see figure below)
Your free webpage speed test results
Your response data is rich with information.
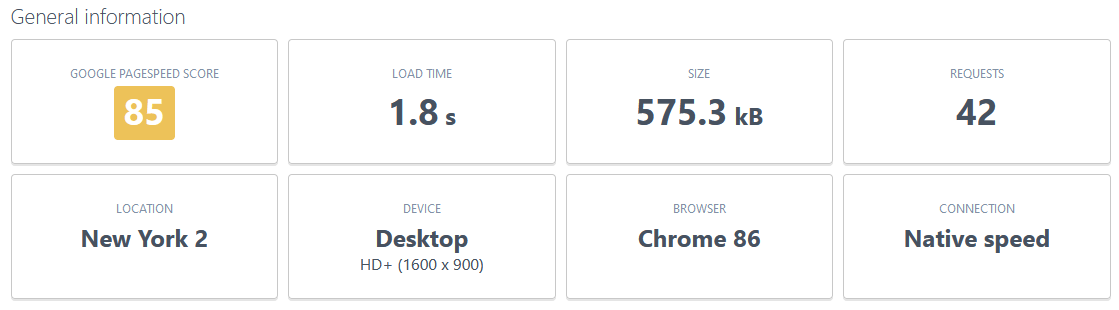
General information
Besides your test’s setup details, you get your
- Google PageSpeed score: Aim for a green score.
- Total load time: Aim for under two seconds.
- Page size: Smaller is better.
- Number of requests: Each request comes with connection times and network latency, so avoid unnecessary server roundtrips.
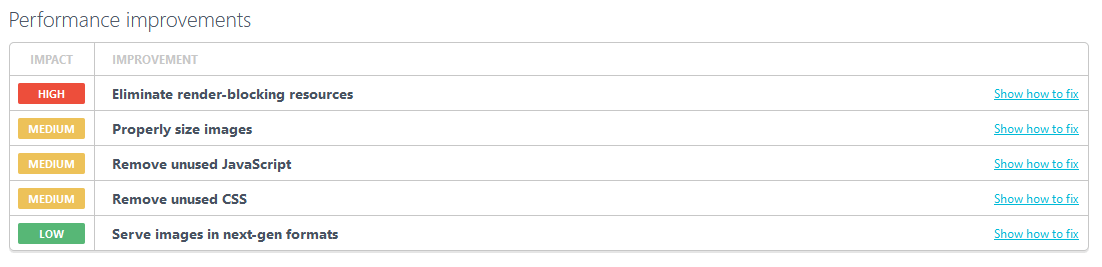
Performance improvements
Along with your Google PageSpeed Insights score, Uptrends retrieves your PageSpeed Insights from Google. Google gives very clear instructions for fixing performance-related issues on your site and prioritizes them for you. If Google marks the recommendation as “High,” your efforts here mean huge performance payoffs (see figure below).
Request waterfall
Your request waterfall gives you page details in three parts. You get a page breakdown, a waterfall chart showing your page load progression, and your page averages.
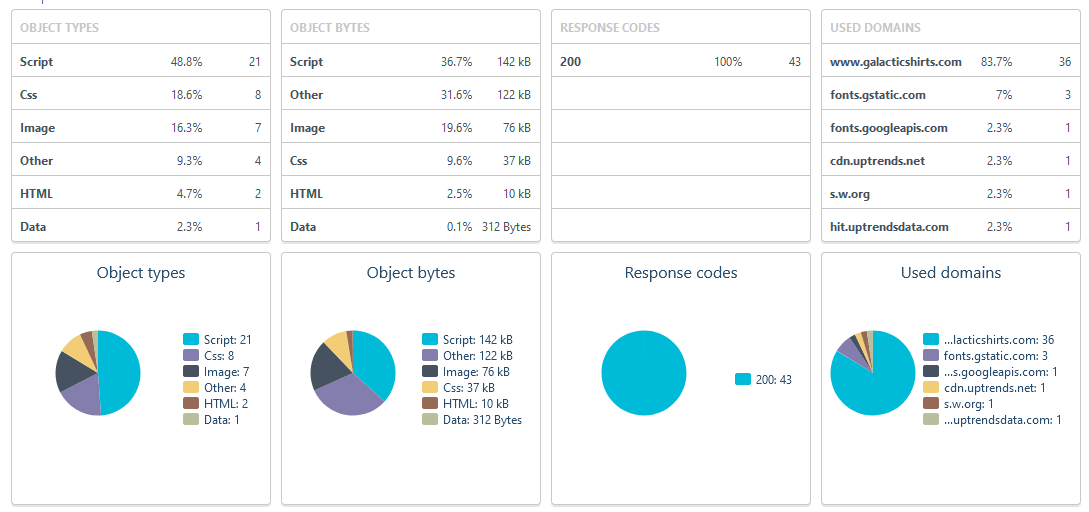
Page detail breakdown
As you can see in the chart below, you can quickly assess the object composition and the distribution of the page size. The breakdown makes it simple to check on your performance budget and rectify any components that you find out of balance.
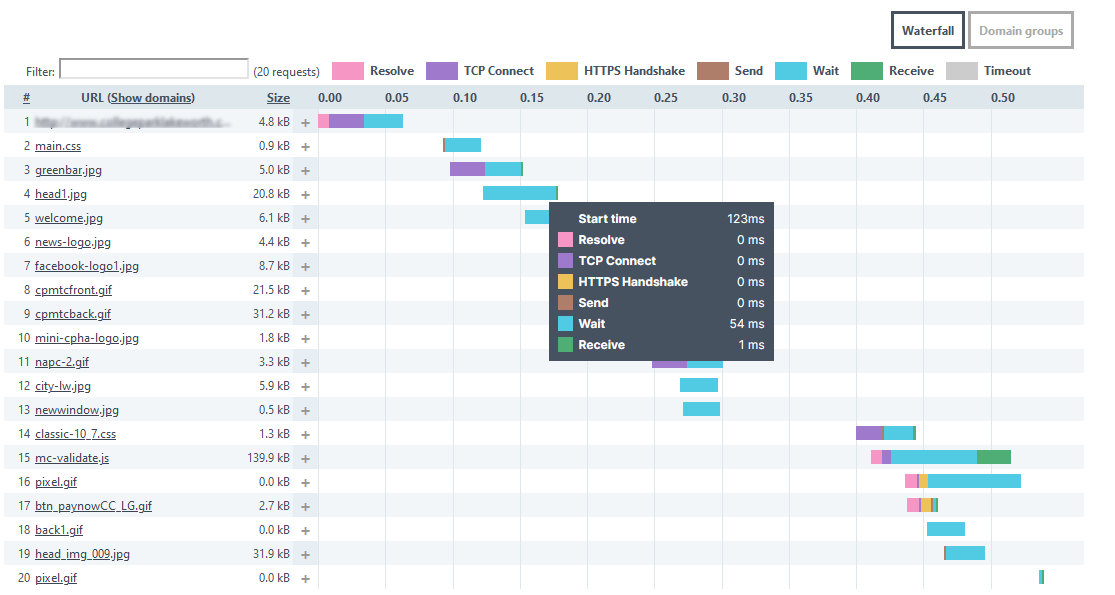
Waterfall chart
The waterfall chart below shows you your timings for each requested page element. You can easily spot bottlenecks, poor performing content (even third-party), and latency issues. Flipping the chart to the Domain Groups, you get insight into each element’s performance based on domain.
Page speed averages
At the bottom of the waterfall chart (see figure below), you get a handy summation of your page performance based on your average connection speeds, wait, and receive times. When auditing your performance budget, the averages help you identify the problem when things get out of whack.

With Website Performance Monitoring, you can automate your page speed tests and get performance reports in your inbox.
CDN performance check tool
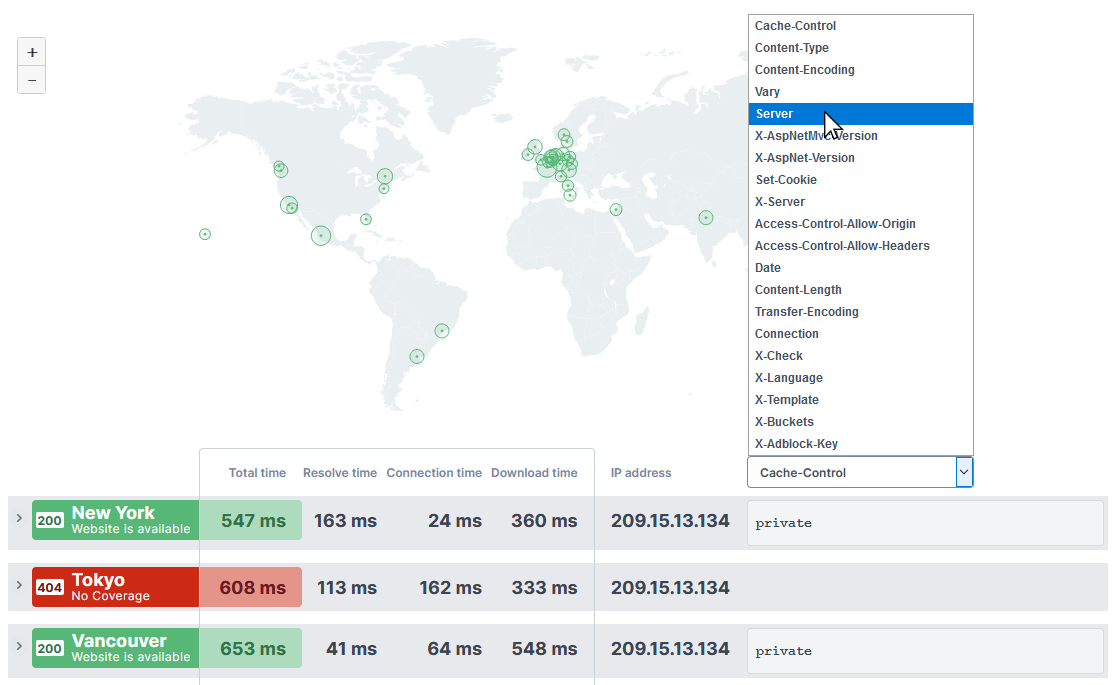
The CDN Performance Check tool starts out looking a lot like the HTTP response header check, and it does give you your header information and response times. The difference, however, is that you do simultaneous checks from as many as forty checkpoints. You get a world map showing where your tests originated, and you get data with the response headers with each check.
Use the dropdown in the upper right to view individual header results for each test or click any result to view its entire header contents.
Simultaneous website uptime check from over 40 global locations
WebPagetest conducts its tests from one location at a time, but that can miss localized availability issues. Uptrends’ free Website Uptime Tool tests from your choice of all the free test locations (over 40) or pick from six different global regions.
Each checkpoint sends a request for the content and reports the response time. With each successful result, you get
- Resolve time
- Connection time
- Download time
- Total time
- Total size (see figure below)
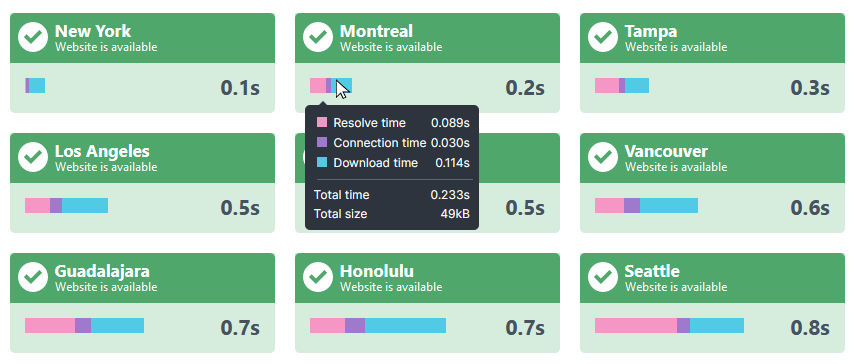
Failed tests appear red with the reason, such as “TCP connection failed.” If you like the idea of simultaneous or parallel testing, Uptrends’ Concurrent Monitoring may be exactly what you need.
Other tools
Uptrends also has a few other quick and easy tools you might need from time to time.
- Ping test: Test your IPv4 or IPv6 from over 40 global locations.
- DNS report: Review your complete DNS records.
- Traceroute: Troubleshoot network issues with a hop-by-hop account of your connection.
- HTTP Response Header Check: Get the details of your response headers.
- What’s my IP address: Get the IP address of your computer.
- What’s my website’s IP address: Get the IP address for any URL.
- SLA and Uptime Calculator: An easy to use calculator to determine your uptime goals and evaluate any SLA promises made.
In conclusion
So, if you’re looking for a WebPagetest alternative, you’ve come to the right place. Uptrends has the free tools to help you check and troubleshoot your systems. The old cliché, “an ounce of prevention is worth a pound of cure,” comes to mind, so start proactively monitoring your systems with Uptrends. We have synthetic and Real User Monitoring solutions to protect your digital user experience.