Website, web application, and API performance is everything. Many factors contribute to performance, such as network latency, use of performance-enhancing practices (use compression), minimizing server requests, and the strength of responding servers and their supporting infrastructure. If server performance is slipping due to load or age, you can find the signs in your reports. This article is about the different indicators in your Synthetics and Real User Monitoring that your servers need your attention.
Signs of server performance issues in your monitoring results
It may not be completely obvious when performance degradation is linked directly to your server or server traffic, but your monitoring can point you in the right direction. Uptrends’ Website, Web Performance, Web Application, and API Monitoring all check for performance. You may even trigger alerting using performance results.
The question is, “How do you know when to look to the server when tackling performance issues?” The answer is in your reporting.
Watch for slow increases in website or API timings
Upward trends in page load or response times may have origins in increased server load or degradation. Viewing performance over extended periods may show a slow progressive slowdown in page performance or API responses that you can most likely attribute to server issues.
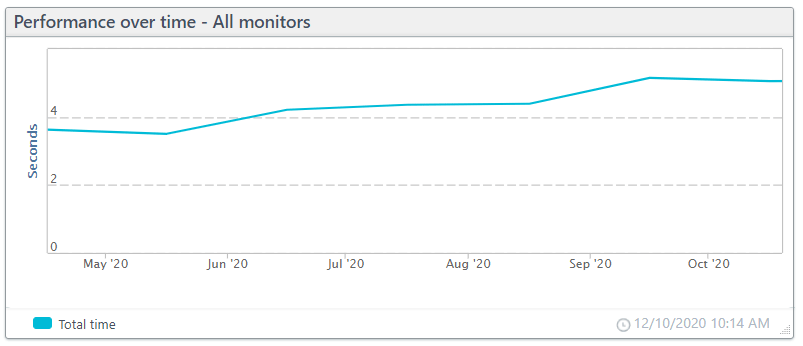
Issues due to configuration, coding, and content tend to cause sudden increases in load and response times. You’ve got to back out for the wide perspective to spot slowdowns due to server load or aging servers. In the chart below, you can see an increase during a six-month reporting period for a web performance monitor (Full Page Check).
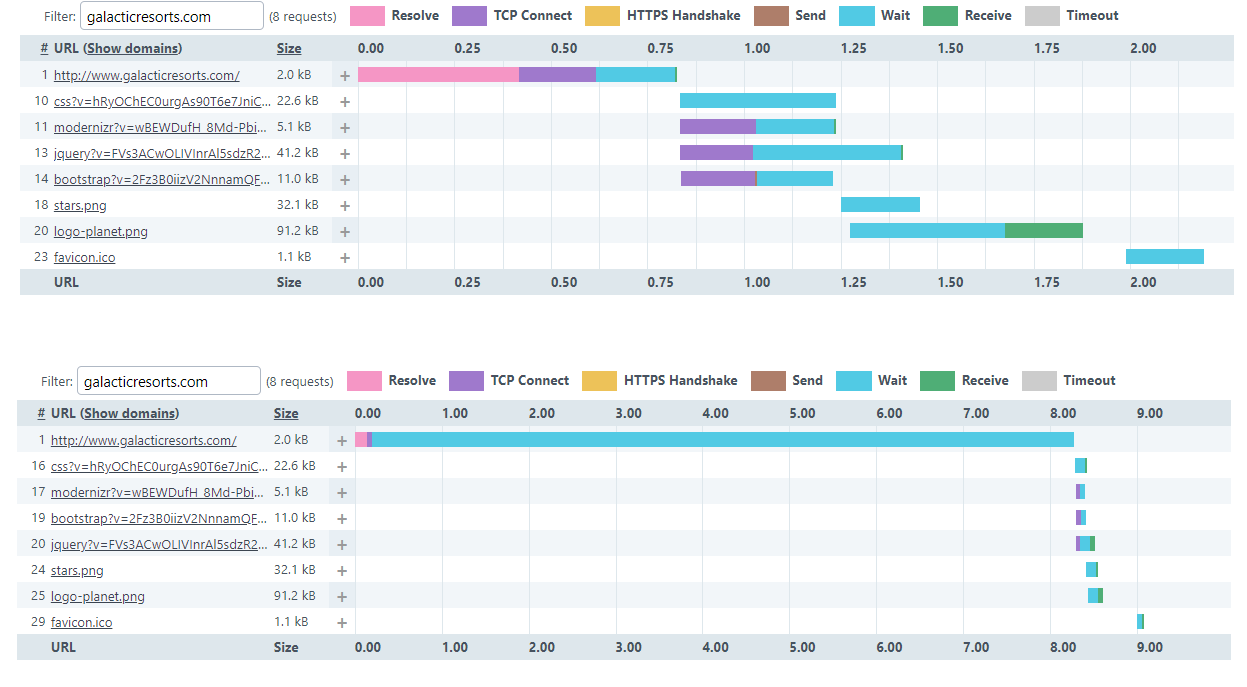
In the figure below, you can see two waterfall charts several months apart. You can see in the bottom chart that the wait time for the initial request is over eight seconds. If you were to scan the monitor logs, you would see the occasional webpage performance test with excessive total load times. However, as time goes by, the frequency of those slow load times increases. Looking at the waterfall charts, you can see that the initial request wait time has gone from less than one second to more than eight seconds for some requests Benchmark your website performance with our free Website Speed Test tool.
Use Concurrent Monitoring to pinpoint specific problem servers
Fast servers can hide the slower servers in your performance monitoring because the data is presented to you based on averages. That means some of your visitors don’t get the quality user experience you intend.
In today’s distributed web, you route users to specific servers based on their location. For example, if you’re in North America, you probably accessed this article through our servers in New York, and if you’re in Europe, you probably hit the Amsterdam servers. If one of those servers sees a heavier load than expected, the performance decline may not show in standard monitoring until it brings down the entire system’s averages.
Standard website speed tests check for performance from one location every five minutes. If you use all of Uptrends’ 223 global checkpoint locations, you’ll get results from each checkpoint two or three times a day at most. Concurrent Monitoring makes tracking the performance of regional servers easier.
Concurrent Monitoring checks from each checkpoint every five minutes
When you’re using Concurrent Monitoring, you designate which checkpoints the monitor uses, and instead of checking from one location out of your selection, Uptrends checks from all of them at one time. That means you get a steady supply of performance (and availability) data affecting the users in each checkpoint area.
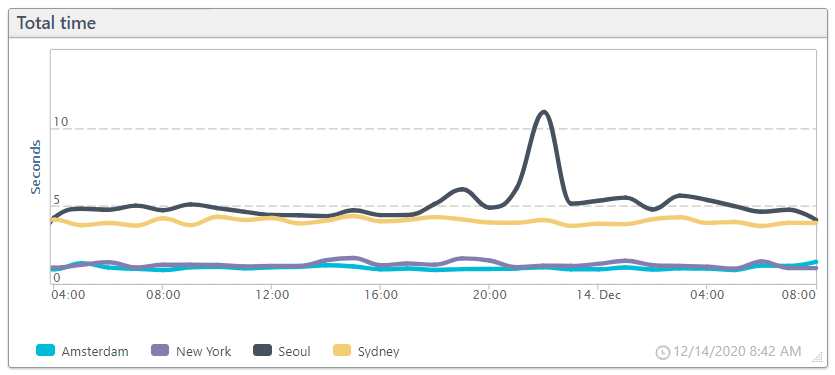
Viewing site performance over an extended period with Concurrent Monitoring, you can identify slowdowns not attributed to network latency. In the chart below, you can see that although latency is higher for Australia and Korea, the performance is steady. However, a more extended reporting period would capture more subtle changes in server response times.
Performance degradation due to server issues using Real User Monitoring
Real User Monitoring or RUM tracks performance for your users when they download a RUM monitored page. RUM tracks performance based on the user’s location, device, operating system, and browser. RUM tracks
- Load time
- Time to first byte
- Page ready time
- Network
- Redirect duration
- DNS duration
- Connect duration
- Backend
- Send duration
- Receive duration
- Frontend
- DOM duration
- Render duration
- Download time
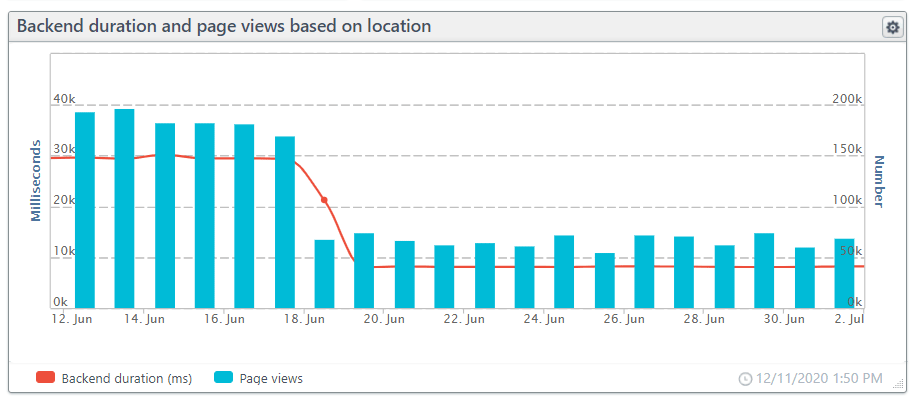
Sorting data based on location and viewing backend duration against page views, you can see below that page views do affect this site’s performance.
Watching your server performance using Infra
If you have access to your servers, you can also bring Infra into the picture. Infra can watch your servers directly. Infra provides server diagnostics that can lead you to the source of the problem, such as CPU load or RAM utilization.
Beyond uptime, there are several different server metrics you should track:
- Concurrent users: The number of users on a system at a given time.
- Request per second (RPS): Since user behavior varies, RPS is a better server load indicator.
- Error rates: High server load means higher chances of users getting errors.
- Thread counts: High thread counts (items that need processing) may lead to higher error rates as the server stops processing waiting requests to manage the current request load. If the hold time on new requests lasts too long, the user gets a timeout error.
- CPU, memory, and disk utilization: Like any computer, if the CPU, RAM, or disk space run short, performance is going to suffer if the server doesn’t fail altogether. Watching these numbers can let you know when your system needs upgrades, repairs, or you need to add more servers to handle the load.
- Average response time (ART) and peak response times (PRT): The average response time is the total time taken for all requests divided by the number of requests. Low ART may mean you’re doing well, but tracking the PRT could indicate that you’ve got problems with some requests that you should investigate.
Takeaways
- There are many different indicators of server load capacity problems.
- Website Performance Monitoring alone may not catch load capacity problems easily when several servers are in the mix.
- Using Concurrent Monitoring to target specific service locations can give a clearer picture of server performance serving a region.
- Filtering RUM data based on location can give you backend performance reports for specific countries and states.
- Infra agents on your servers can report performance and uptime information to you directly, and soon our developers will have Infra data available to you within your Uptrends account. Stay tuned!