Do you want to know how to measure the full impact of third-party scripts and page contents on your website? In this article, we step you through the process as we analyze the performance impact third-party elements have on a popular content marketing site. We go beyond looking at how a single third-party supplier affects page performance and show you how to measure how the different types of third-party content affect page performance.
What do we mean by third-party website content?
Websites typically have hundreds of page elements. When that content comes from different domains other than the primary site, the content is most likely a third-party element. Your website may use third-party elements for several different purposes:
- presentation (fonts, scripts, style)
- advertising (pop-up ads, banner ads, video messages)
- added functionality (chat services, social share buttons)
- analytical purposes (user engagement, activity tracking)
The elements come in many forms, such as script files, cascading style sheets (CSS), HTML, video, and images. Every page element carries a performance cost, but some elements have a larger impact on your page performance. You may have spent a lot of your time optimizing your content’s speed, but your page still loads slowly. Checking your third-party content is a good place to start when tackling some of those performance hurdles.
How we measured the impact of third-party elements
Have you ever found yourself going back to a site that makes you a bit crazy because of annoying obstacles between you and the content? However, despite the slow, jerky page loads and the constant pop-up ads and videos, you find the contents worth the annoying distractions. Well, our monitored website for this article is one of those annoying sites with really great content. The site publishes articles, audio, and video content geared to answer commonly asked questions on various topics, but our article isn’t about the site’s content. This article is about how the third-party content (most geared towards advertising) affects the site’s performance.
Monitor type and setup
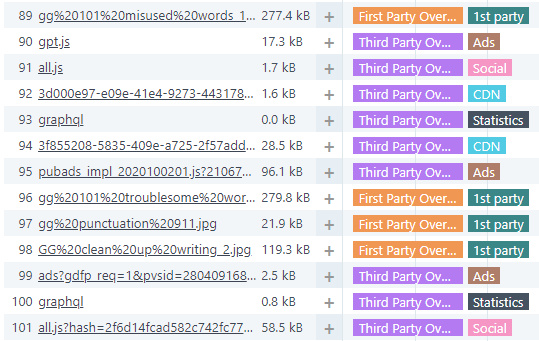
Using our Full Page Check (FPC) web performance monitor type, we set one of our monitors to watch the site using a Chrome browser. From this initial monitor, we track the load time for the entire page. Also, by enabling the enhanced FPC option in the monitor settings, we can toggle the waterfall report to see the content type and origin. We went through the page and identified all the third-party content and categorized it using domain groups for easy identification.
Selectively disabling third-party content
The FPC monitor loads a page into a fresh browser of your choice: Chrome, Firefox, Internet Explorer, or Phantom JS. During the load process, you can instruct Uptrends not to retrieve and load elements from certain domains. For example, you can use domain blocking to disable Google Analytics by blocking URLs that contain google-analytics.com.

Note: The above is a common example, but you can also quickly block Google Analytics by checking a box on the same tab.
We set up a total of 11 FPC monitors to watch the site:
- one that loads all page contents
- one that blocks all third-party content
- seven separate monitors blocking analytic elements from different providers, including Google Analytics, jsdrn.com (a hosting and user tracking site), scorecardresearch.com (user tracking/analytics), Twitter Analytics, and Usercentrics (tracking and GDPR compliance functionality), other miscellaneous analytic tool providers, and one monitor blocking all analytics
- one that blocks all advertising
- one that blocks social media scripts
Where did we monitor from?
We monitored the site using Concurrent Monitoring. Concurrent Monitoring fires multiple simultaneous checks from designated checkpoints. Because our monitored site publishes content primarily for a US audience, we used three US-based locations out of our 221 global checkpoints: Atlanta, Los Angeles, and New York. With three concurrent monitors running every five minutes, each monitor conducted over 6000 performance checks on the site in the course of a week.
The test results
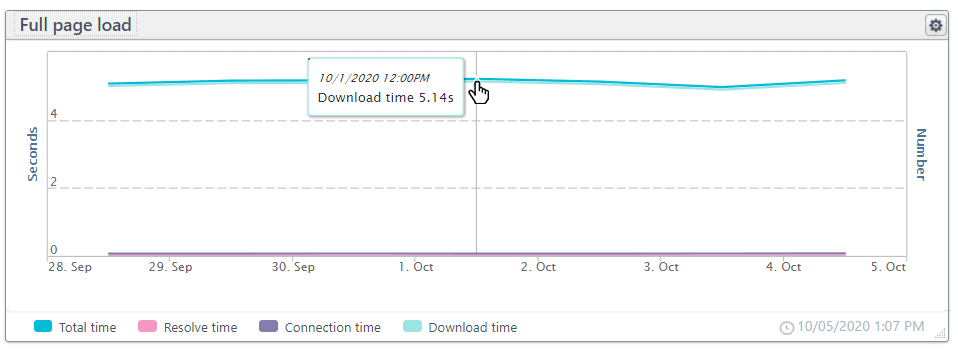
As we mentioned earlier, the publishers of our chosen site fill the page with annoying third-party content, but the site is still popular with over 2.3 million unique monthly visitors and dwell times over four-minutes. So, based on the golden rule of two second load times, it comes as a shock that the site’s average total page load is 5.12 seconds. As you can see in the graph below, the page performance suffers primarily due to download speeds.
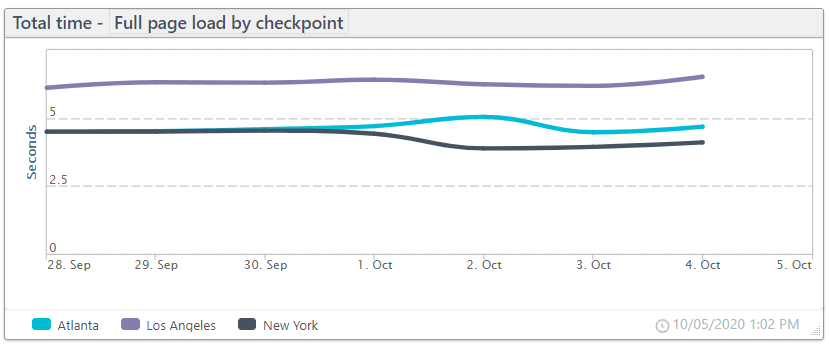
Location-based results show that the west coast experiences slower load times than the east coast during the simultaneous testing (see chart below). The slower load times indicate that the site could use a well-placed CDN endpoint on the west coast, but there are other problems.
The impact of the third-party elements by domain group
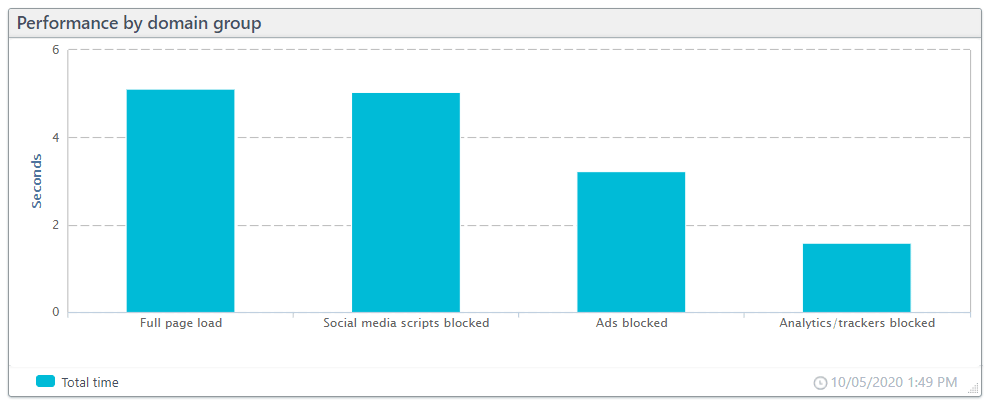
Of course, your site may have third-party content types not included here, but for our monitored site, we identified three main groupings of third-party content: social-media scripts, advertising, and analytic scripts including trackers. With a baseline of 5.12 seconds for a full-page load time, let’s see how the different content types affected performance. The chart below shows how well the page performed with the various types of third-party content blocked.
The performance impact of social-media scripts
We blocked all elements originating from Facebook, LinkedIn, Twitter, and Pinterest. Blocking the social-media scripts had a small impact; without downloading and executing the social-media scripts, the page loaded .08 seconds faster. Although .08 seconds is not insignificant, when considering the page performance as a whole, social-media scripts contribute very little to the site’s excessive page load times.
The performance impact of third-party advertising content
Our test site has 24 third-party elements with ad content. With the 24 elements blocked, our page performance improved by 37% for an average page load time of 3.22 seconds. A two-second gain in performance is significant, but unfortunately, tied directly to revenue, the performance cost is difficult to avoid. Although you can’t readily discard these elements, it doesn’t mean you can’t try to optimize them.
The performance impact of page analytics and tracking software
Just about every website includes analytic tools to monitor user engagement. However, those very tools could have more impact on user engagement than the page’s primary content. Our test site uses multiple different analytic tools and tracking software. As a whole, the analytics and tracking elements contribute 3.59 seconds to the total load time.
We observed the impact of the page analytics and tracking early in our testing, so we decided to break the category down even further to see which domains carried the highest performance costs. As you can see in the chart below, most analytic elements (many of these have multiple scripts) have only a small impact with most adding .03–.07 seconds to page load times. However, jsrdn.com and Usercentrics’ add 1.27 and 2.9 seconds, respectively, to page load times. Let’s dig deeper.

Remember, the chart shows the page performance without the indicated third-party content.
We get the following results by filtering the waterfall chart for elements originating from jsrdn.com or its sub domains.
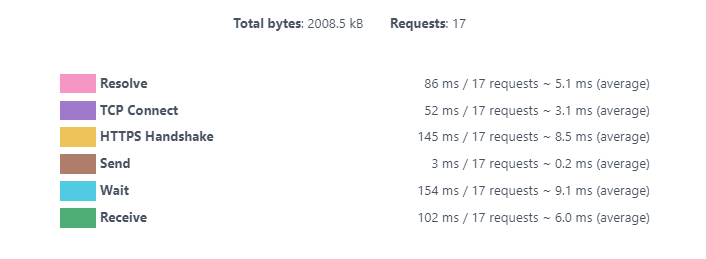
The page contains 17 requests to the domain and sub domains. Each request requires a new resolve, handshake, and connection, so you can see in the results above that these connections add .28 seconds to the total page load time.
When we look closer at the individual elements, we find nine of the 17 elements are tracking pixels. Tracking pixels are tiny one-pixel images used for the collection of user data. Invisible to the user, these image files still carry a performance cost of over a half second. These files combined contain a total of .3 kilobytes, which is quite small. However, the elements add no value for the user yet add .54 seconds to the page load time. To be fair, jsrdn.com also hosts other graphics and videos that do appear on the screen contributing two megabytes to the page’s visual content.
![]()
The Usercentrics content only includes nine requests; however, it slows the page load by 2.9 seconds. Why? On close examination, the total size isn’t especially large at 261.7 KBs with connection times at 85 ms for all nine requests.
So, where is Usercentrics eating up all this additional time? Examining the full-page load monitoring data, you can see that the first Usercentrics element loaded is a JavaScript file. Unless set to asynchronous, JavaScript files block page load progression. Viewing the waterfall chart (below), you can see that the page load progression stalls for two-thirds of a second while element number ten downloads and processes.
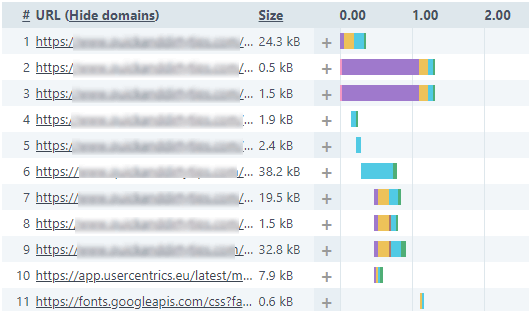
The JavaScript file also includes references to the other eight Usercentrics files. Blocking the first element blocks all other Usercentrics files, resulting in a savings of 2.9 seconds to total load time. However, the functionality Usercentrics provides is necessary for compliance with European Union privacy policies, using asynchronous loading could possibly reduce the impact this functionality has on the page speed.
How can I check on the performance impact of my third-party elements?
Uptrends Full Page Check is a vital tool for verifying your website performance. By scrutinizing a Full Page Check waterfall report, you gain insight into your page elements. To take a closer look at how your third-party content affects your site’s performance, you need to do a few things:
- Identify the third-party domains used on your page.
- Set up an Uptrends Web Performance Monitor.
- Open the Full Page Check detail report.
- Scroll to the waterfall chart.
- Using the filter at the top of the chart, enter the third-party provider’s domain name you would like to review.
- Examine the waterfall report and the summary at the bottom of the page for anomalies for each provider.
As we did in our example above, you can also block the domains to gain a long-term perspective of how the domain affects your performance by blocking the element on the Advanced tab of the monitor. You will need two monitors, one with the third-party domain blocked and the other with the contents loading for the entire page comparison. Filter your performance dashboards on the two monitors to review your data.
What do I do when I find performance problems with third-party content?
Documentation is your best friend when it comes to proving to providers that their presence on your site negatively impacts your user experience. Uptrends gives you the ability to save your data to PDF, Excel, or HTML email. Present your Uptrends reports to your provider to work on a solution together.
Conclusion
Third-party content is subject to change without warning affecting your page performance and your users. A Full Page Check web performance monitor can help you catch performance problems and gives you the tools to diagnose them. If your website’s performance suffers due to a third-party content provider, with Uptrends, you have the data to prove to them that their content is problematic.


