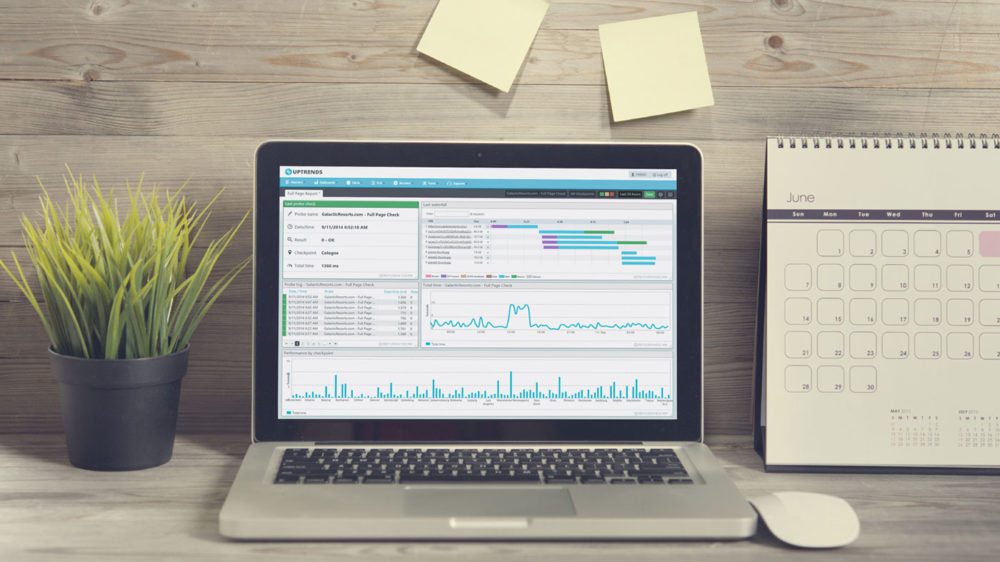
Uptrends offers a variety of ways to look at the data being generated by your website. One effective tool is our Full Page Check, which will generate a detail rich waterfall chart to show you exactly how quickly every script is executed. If you find that your website or portions of your transactions are not performing up to speed, a Full Page Check could help you hone in on the culprit.
Visualize your website elements
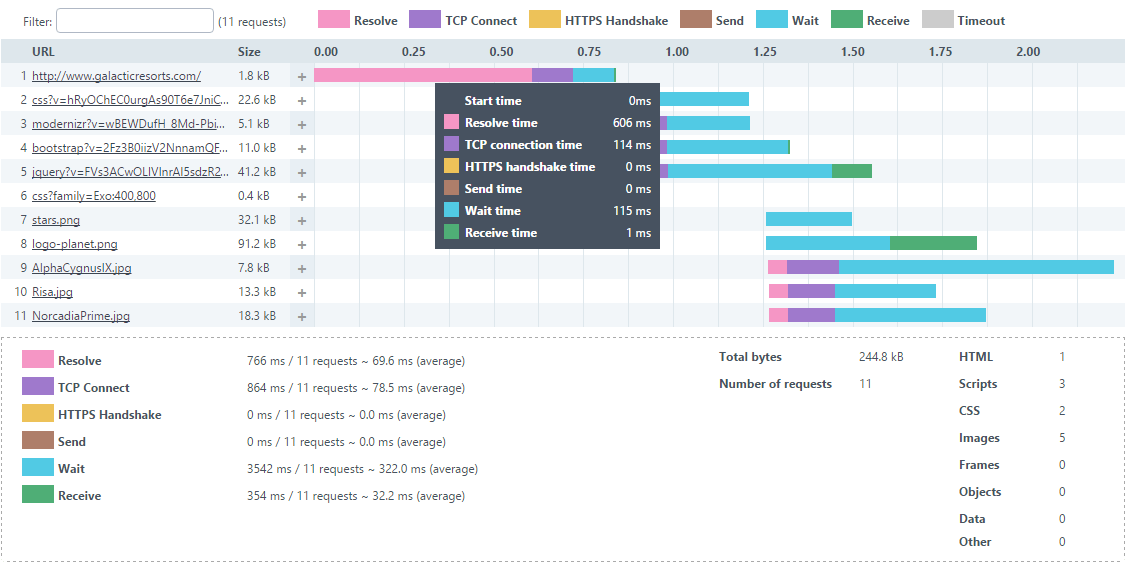
Instead of giving you a simple alert or spitting out some numbers, the waterfall chart breaks down every image, stylesheet, script and all other elements generated across the web page. This shows you exactly how large each element is, how long it’s taking to connect and download, and exactly what kind of data the browser is spinning. Check for faulty links, showing if you’re receiving a 404 error during a page load.

Get your HTTPS straight!
Likewise, you can check if your HTTPS configuration is operating correctly; lots of long HTTPS handshakes could indicate that a problem is occurring. By hovering over the waterfall chart, you’ll be able to see the exact time it took for the HTTPS handshake to complete.
Analyze load times over time
Full Page Checks are also a great way to measure trends. Is there a specific time of day or point in the week that your website gets more visitors? When will your website performance be strained the most? By running the Full Page Check, Uptrends will monitor the site 24 hours a day and present you with the analytic information. Check your website performance averages for a period of a day, a week, a month, or even longer.

The impact of third party content on your site
You want your content to be shared. And thus it seems a smart idea to add that Tweet button to your site. We totally agree! However, adding in all those external scripts can’t be done without keeping an eye on them closely. With the Full Page Check, you will be able to group your third party content using so called Domain Groups. Domain groups contain the definition of how individual elements within FPC waterfalls are separated. These separations include: First Party, CDN (content delivery network), social media, web analytics, advertising, etc. By looking at your webpage elements in a grouped fashion, you’ll see how load times of these groups compare to the total load time of your page.
HTTP headers: inspect a lot
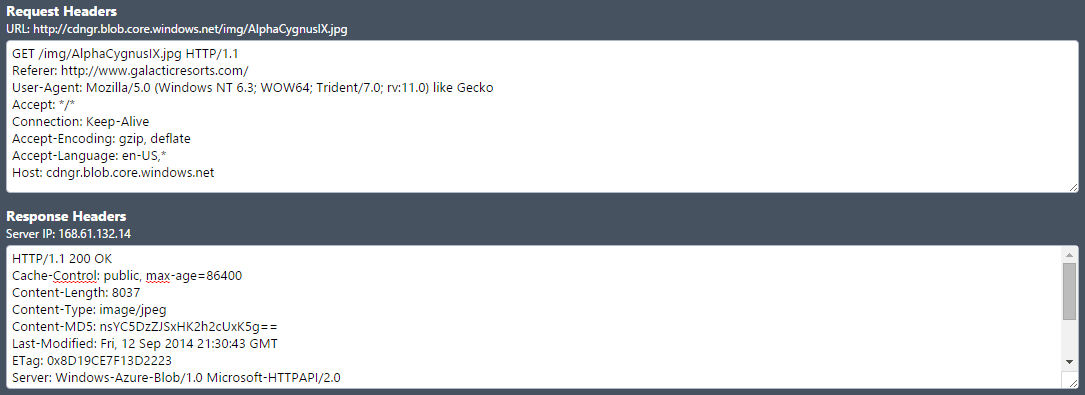
HTTP headers are the core element of HTTP requests and responses, and they carry lots of information about the client browser, the page that’s requested, the server, and more. Check which IP served the response to inspect if your IPv6 configuration is working properly, as long load times can be indicative of an IPv6 issue. Monitor issues with your CDN provider, and provide them the response headers for detailed information. Is the response properly compressed? HTTP headers have the answer.

Get more in depth alerts
In addition to generating the waterfall chart, you can customize the Full Page Check to push out alerts for specific settings. Some of the things you can customize include:
- Check for a maximum size of the entire page
- Check for a maximum size for a single page element
- Content match
- Load time limits of the entire page
- Check for errors on page elements
- Generate an error when a certain percentage of the page elements fail
These settings will help you make sure all elements of your web page are acting appropriately.
The benefit of three monitors
You may have noticed that a Full Page Check uses three monitors. Why is this? It’s because it requires more processing and a lot more downloading than a regular http monitor, therefore it’s a bit more expensive.
If you’re a fan of our Full Page Checks you’ll be happy to hear that we now offer Transaction Waterfalls in our Enterprise edition. Interested to see how we can help you improve your website performance? We’d be happy to help out.


Leave a Reply