
September 2017 saw several devastating hurricanes in the Caribbean. Our team in the Boca Raton, Florida office watched anxiously as Harvey slid by, Irma went overhead, and then Maria swirled just off the coast. As you can guess, our team paid close attention by following the weather on television and the web. Frustration mounted as the team had to wait for weather news sites to load, so we thought it was the time we took a closer look at weather-related websites to see exactly how they compare.
We set up 12 Full Page Check monitors to load a real browser every 20 minutes and check the performance of each of 12 different weather-related sites from all thirty-nine US checkpoints. The Full Page Check reports on each element’s time to complete the:
- Resolve
- TCP Connect
- Https Handshake
- Send
- Wait
- Receive
- Timeout
The report also gives the average and total time for each of the above as well as the total download time for the entire page. Let’s take a look at the results.
How well did the Weather sites perform?
We watched the sites for a total of 65 days to see if weather events affected performance. Although six hurricanes occurred during the observation time, we did not see any patterns that might have coincided with heaver site traffic due to the weather-related events. As you will notice in the graph below for the top and bottom five sites, none of the patterns indicate any significant changes in performance due to a weather news event.
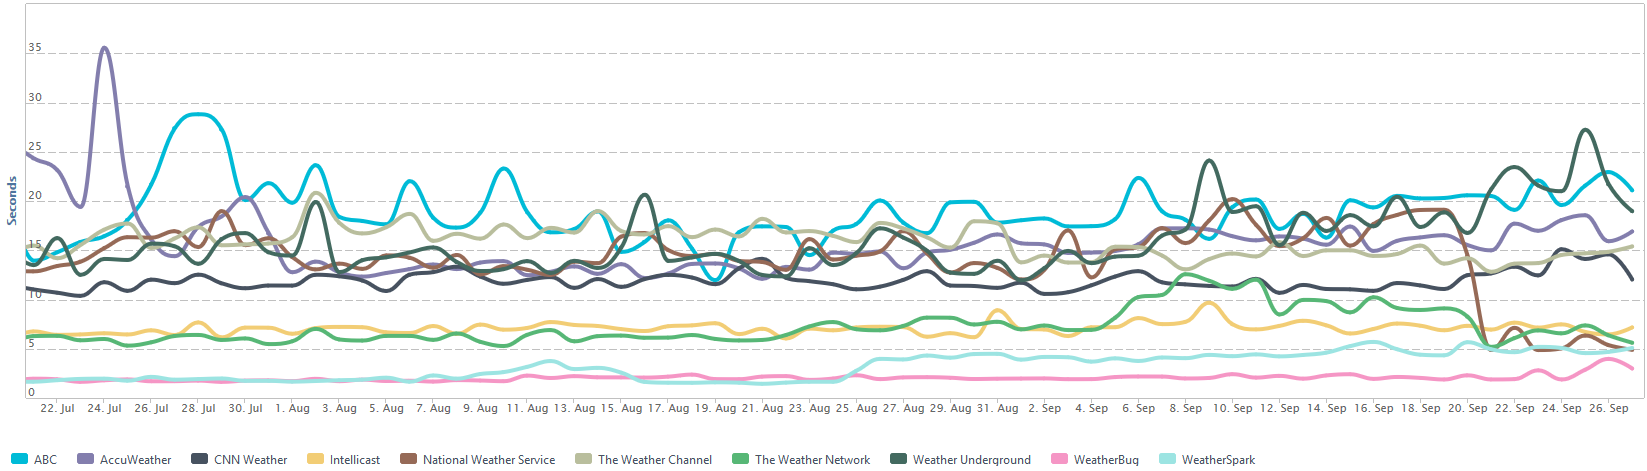
Performance over time
As we suspected from our own experience, there was no real competition for the top performing sites. As the pink and light blue lines indicate in the chart above, WeatherBug and Weather Spark maintained the highest performance during the full testing interval. Looking at the week of September 20th through the 27th when there were no significant weather events, the performance hierarchy becomes more obvious.
The graph below shows the daily average performance for the top and bottom five sites. WeatherBug maintains fairly well at the two-second range, Weather Spark, which did equally well during the first several weeks of tests, had a performance slip in late August. Weather Sparks performance dropped by another three seconds for an average of five seconds due to the number of requests climbing from nine to 39.
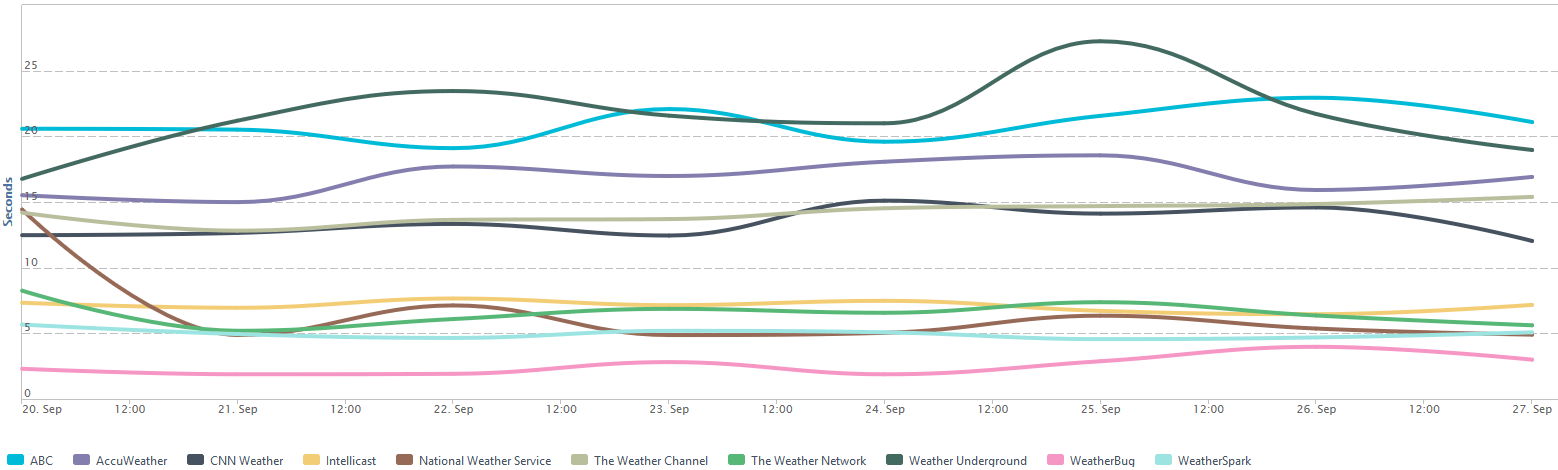
Performance September 20-27
The chart below shows the average and median times for all of the tested sites.
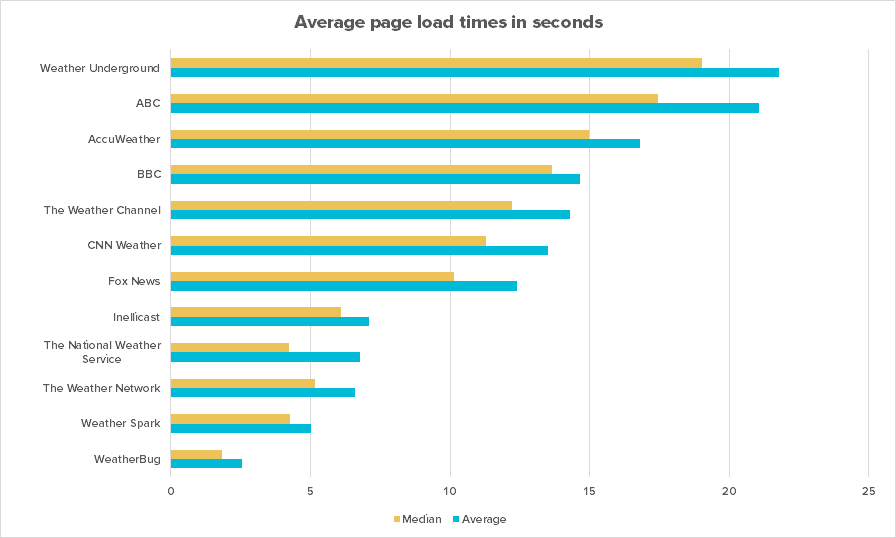
According to Alexa’ s rankings, the top three most popular weather news sites all finished in our bottom five. With load times higher than 14 seconds, these sites more than exceed the expected two-second rule. If you have ever experienced these sites yourself, you may have found them equally frustrating. So let’s take a closer look at these pages and see what these sites could do to improve their user experiences.
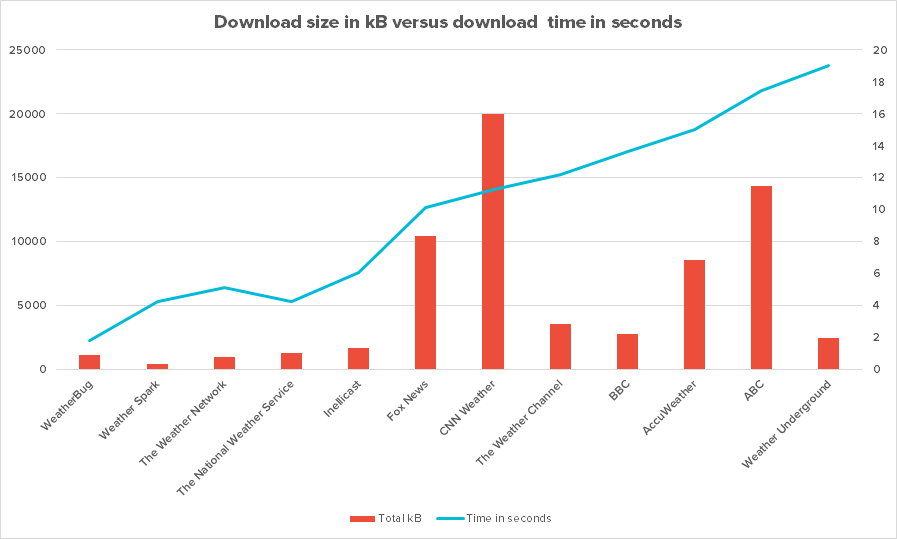
Download speeds, of course, affect page load times, and the more data to download the longer it will take. When we chart the time against download size, although you can see a correlation, download size is certainly not the primary factor affecting page performance.
It seems that websites keep trying to insert more and more stuff into a single page. Based on our discoveries with the weather sites, we see a definite connection between element counts and performance. In the Request versus time chart below, you can see a definite correlation between element counts and page performance.
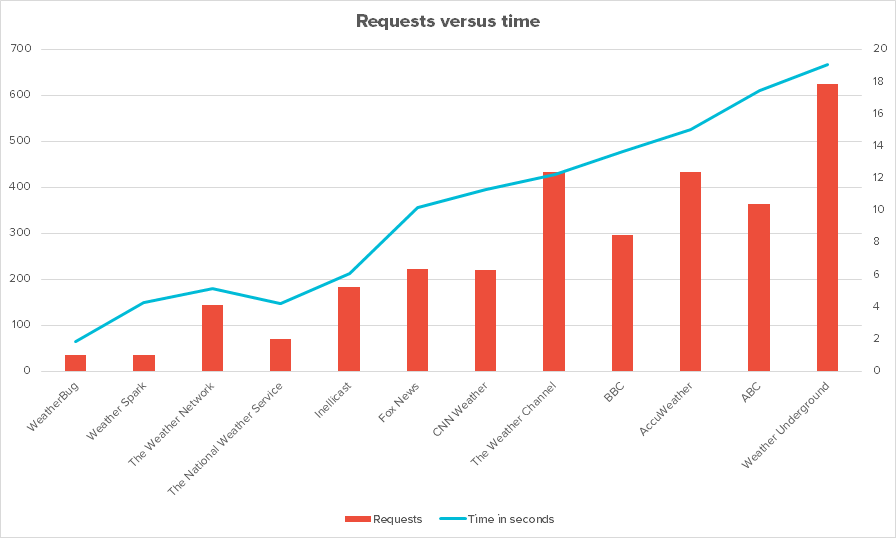
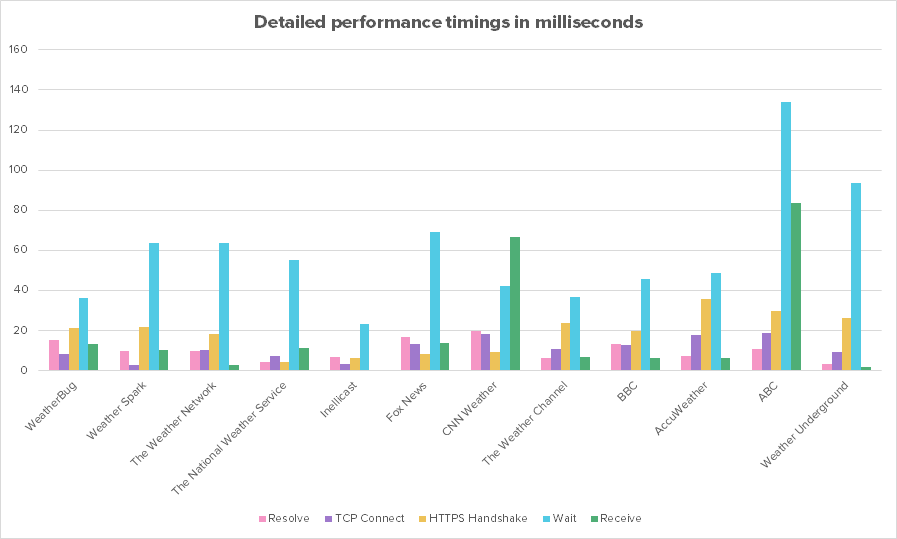
Taking a deeper dive into the connection timings, we see that the slowest sites have average wait times significantly longer than the other sites, and the slower sites take longer in the handshake. The lengthy wait and handshake times multiplied by the high number of requests combine to contribute to the poor performance.
Improving website performance
The path to a better performing website is first to know your current performance levels. You can’t get those numbers from behind your firewall, and you can’t get that information from a single test. Understanding your performance means detailed checks from your users’ locations. Uptrends has both synthetic and real user options for you.
Synthetic Monitoring
Synthetic Monitoring is a proactive approach that actively engages with your site and alerts you to page and performance issues. Uptrends Full Page check uses a real browser to connect to your site and load your page and track the performance of the entire page and each element on the page. Your results for each check displays in a convenient waterfall report where you can see the full progression of your page loading. Using Uptrends’ 168 worldwide checkpoints, you can choose test locations based on the geographic location of your site’s users.
Real User Monitoring
While Synthetic Monitoring is an active approach, Real User Monitoring is a passive monitoring method that waits for user interaction to track page performance. Real User Monitoring records your pages’ performance based on the experience of your actual site visitors. A small script file gathers the performance data and sends it to the cloud. Uptrends gathers the data and reports on the performance based on device, operating system, location, browser, and pages viewed.
Once you have your site’s performance details, you can begin to analyze your page based on the connection and elements. Using our weather site examples, the biggest contributing factor to poor performance is the number of requests. Reducing the number of HTML elements, combining CSS and script files, and caching images and other page elements can drastically cut down page load times.
Fix any latency issues due to location. Real User Monitoring will tell you exactly where your users are located. Using CDNs (Content Delivery Network), you can reduce the distance between your content and your users. By reducing the distance, you improve wait times.
Optimize images and content based on user environments. Why deliver image files sized for the desktop to your mobile users? Knowing your user’s environments can facilitate content planning, and direct your synthetic testing efforts.
Conclusion
The reliability of weather forecasts is often erratic at best, but weather websites don’t need to be. With the proper monitoring and implementing a few performance-enhancing changes, the weather websites could build their reputations and promote brand loyalty. Show your users that you care by improving their experience. Start with a free 30-day Uptrends trial, or schedule a demo today.


Leave a Reply