Imagine that your API response includes data that you would like to track and get regular reports on, and you may even want to generate alerts when values hit certain thresholds. You’re already monitoring for API performance and function, but how about grabbing the other data at the same time. Wouldn’t it be nice to capture the data, evaluate it, and store it in your Uptrends account? You can with Uptrends’ newest Multi-Step API feature, Custom Metrics. Uptrends Multi-Step API Monitoring can now capture any numeric data coming from your API and make it easy to chart and track your response data. You can even set up alerting based on your custom metrics.
Follow along, and we’ll step you through how this new super-cool feature works and show you how you might use it to track your data.
What are Custom Metrics?
A custom metric is a numeric API response data point that you want to capture and track using Uptrends. Multi-Step API Monitoring lets you pull out and evaluate any returned data value using comparison operators. If that data point is numeric, you can turn it into a custom metric. After assigning the value to a variable, you can add the data to your custom metric list in your monitor’s step settings. Uptrends makes the custom metric values available to you in special custom metric tiles you add to your custom dashboards.
Why use Custom Metrics
Your Multi-step API monitor automatically tracks availability and performance on your API requests, and you can pull and evaluate response data. However, beyond validating the response values and reusing them in future requests if needed, Uptrends doesn’t capture and store extracted API response data. With Custom Metrics, you can capture, evaluate, and track the returned numeric values in your dashboards and reports. You can even generate alerts based on the results of the comparison operators. As long as your API sends the numeric value, you can track it and get alerts.
You may have all kinds of data that you want to grab and chart. You may even want to set up some special API endpoints to track data using Uptrends monitors. We’ve put together a list of some metrics you may want to include for alerting and trend analysis.
Ecommerce
- Sold or available quantities
- Gross/net sales
- Number of active shopping carts
- Quantity of orders queued and awaiting processing
- Average cart/order totals
- Abandoned carts
Network
- Utilization
- Bandwidth used
- Network performance
- Packet loss
- Jitter
Data center
- Power usage
- Temperature and other environment information
- Transaction throughput and response time
Support
- Open support tickets
- Calls in queue
- Active chat sessions
How to set up a custom metric
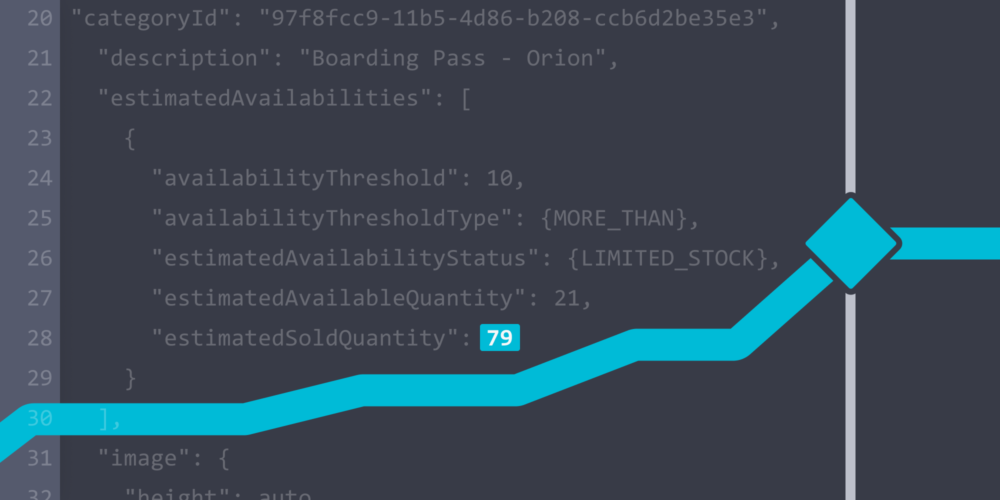
Multi-Step API Monitoring can capture any value returned in your API response using either JSON, XPath, or a regular expression. Once you retrieve the value and assign that value to a variable, you can make a custom metric if the value is numeric. If you would like to receive alerts based on the value, you can also add an assertion.
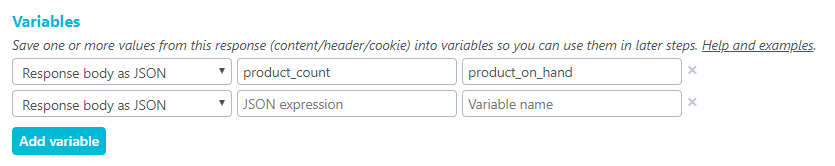
To set up a variable
- Switch to the Response tab on the step that returns the value.
- Click Add variable.
- Choose the response type.
- Add the expression needed to access the data point.
- Name the variable.
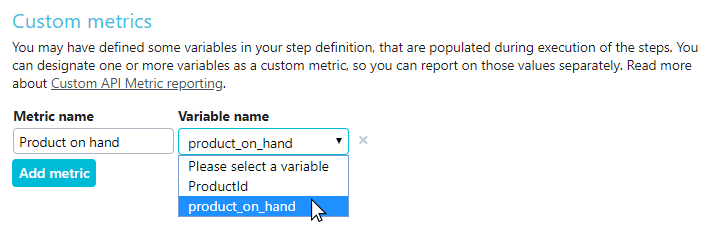
Now that you’ve saved the value, you need to add the variable to the Custom metrics section at the bottom of the screen.
- Click Add metric.
- Name the metric. The metric name appears in your reports.
- Choose your variable from the Variable name drop-down.
You’ll want to test the change for any errors, but otherwise, you’re done. You’ve captured the value, and Uptrends now stores the value with the rest of your monitor data.
Add the custom metric to a dashboard
You’ve captured and assigned the custom metric to a named variable in your Multi-Step API monitor’s step, and you’ve set up the variable and assigned it a name for reporting purposes in your monitor’s settings. The metric is now available to you when you add a Custom metric tile to your custom dashboards.
To see your data:
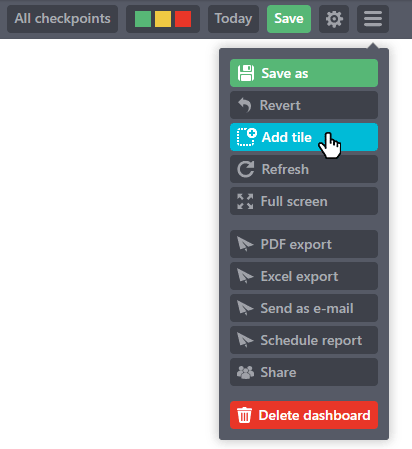
- Open a custom dashboard or create a new dashboard.
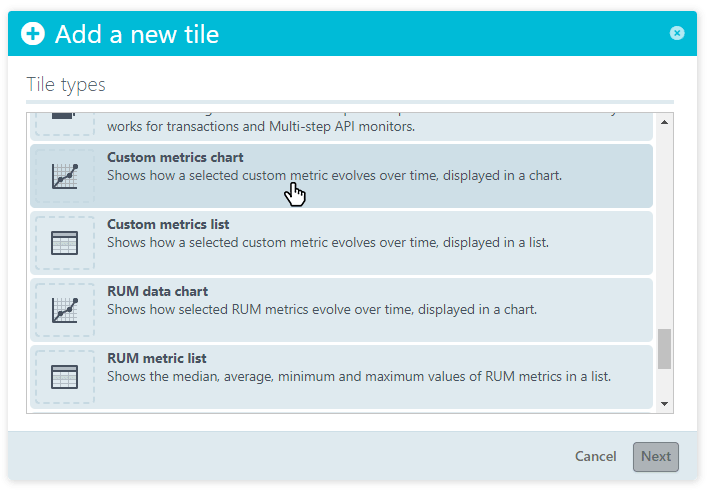
- Add a new tile.
- Choose either a Custom metrics chart or list.
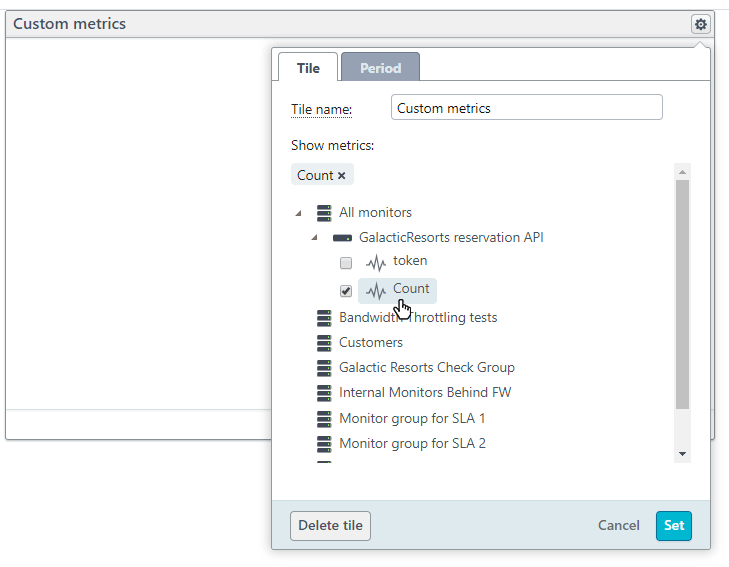
- Click the gear icon in the top right of the new tile.
- Find your API monitor in the monitor list.
- Click to see the available custom metrics.
- Select the metrics.
- Click Set.
- Save your dashboard.
The values displayed in your Custom Metric tiles are an average based on the hour. You can also view the results on a check-by-check basis in your check detail results. Just click on any check record in your monitor log to see your custom metric value below your step details in the check detail report.
In conclusion
Custom Metrics is a bonus feature of Uptrends’ Multi-Step API Monitoring. The feature lets you extend the functionality of your API monitoring to include API data points you would like to track alongside your other API performance and uptime data. If you have a Business or Enterprise account, you can start using Custom Metrics today. If not, you can talk to your Success Coach about an upgrade. If you’re new to Uptrends, sign up for a free trial today. You can try Multi-Step API monitoring with Custom Metrics with a free thirty-day trial, plus you get to try a whole lot more great Uptrends solutions.