
Happy 2020! Uptrends is looking forward to the new year, and we have lots of great things planned. We expect 2020 to be as exciting as 2019 with all kinds of new features and functionality. In this article, we take a look at all of the new functionality and features added in 2019 that are available to you now.
Self-Service Transaction Monitoring
To start our review with a bang, Uptrends released Self-Service Transaction Monitoring late in 2019. The revamped Web Application Monitoring solution allows you to manage your transaction scripts yourself. You can still record your transactions using the Transaction Recorder. Once recorded, you have the option to upload the recording to your account to edit and test the script or send the recording to Uptrends Support to optimize and test the scripts for you. Self-Service Transactions give you the power to do as little or much as you want with options for every skill level. You take control, and we are here to help you out.
You can edit your transaction scripts using the new Step Editor or flip over to the text editor and work with the code directly. We’ve also added options to our API to let you automate your monitor interactions.
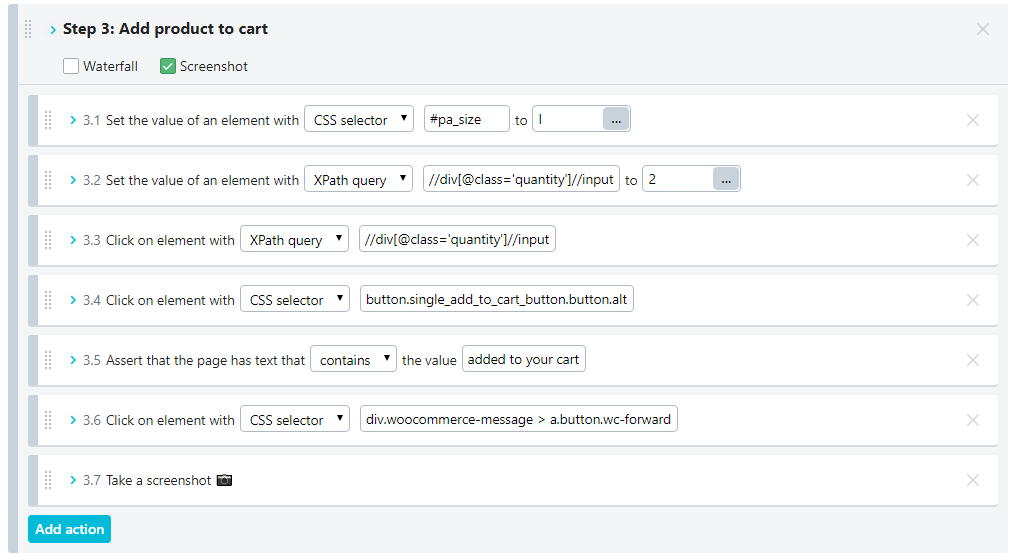
Figure1. Self-Service Transactions step editor
Alerting
We’ve been busy in 2019 with the alerting options available to you. We’ve added new integrations, dashboards, and dynamic email messaging.
New Alert Status and Alert Log reports
Based on your alert definitions, Uptrends sends alerts when an error occurs and again after the alert condition is corrected. Previously, we only showed you when the error state started and ended, but you didn’t have any information about the alerts themselves. Well, we fixed that.
Now you can get into the nitty-gritty details of your alerts. Your Alert Status (figure 3) and Alert log (figure 2) now give you the details about your alerts. Your Alert Status (Figure 3) and Alert log (Figure 2) tell you about
- What time Uptrends sent the alert,
- Which monitor had the error,
- The alert definition used,
- The escalation level reached, and
- If, when, and who confirmed the alert.
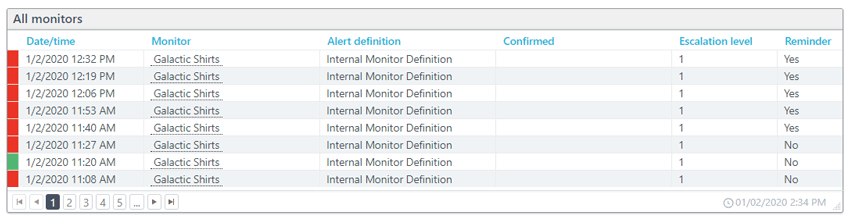
Figure 2: Alert log
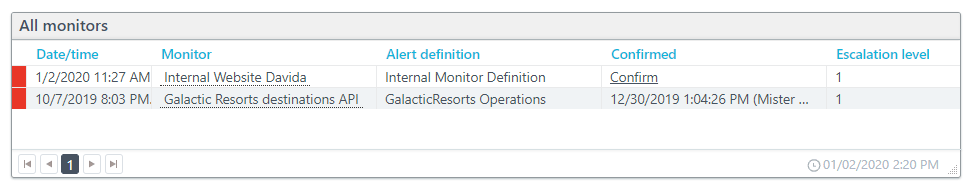
Figure 3. Alert Status
Integrations
We gave you more integration options in your alert messaging choices. Besides SMS, email, phone/voice, Slack, PagerDuty, and StatusHub, we’ve added support for VictorOps, ServiceNow, and webhooks. As long as your favorite apps can receive incoming messages, you can integrate them with Uptrends using webhooks.
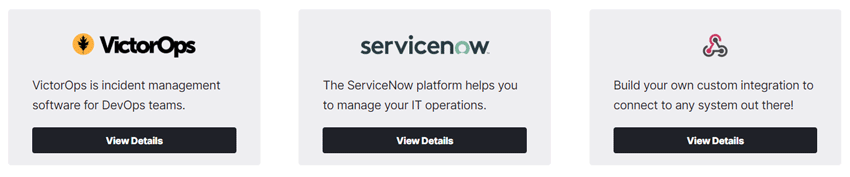
Figure 4. New integration choices
Add dynamic content to your email alerts
More information is always better when it comes to alert messages. With Uptrends, you can now add references to custom fields in your monitor settings. Using the custom fields, you can send extra details about the monitor. For example, you can include information such as the hosting location, which data center and racks house the servers, or which error protocols to follow. To include dynamic content, use the Messages field in your alert definitions and reference custom fields inside your monitor. Learn more.
Monitor modes
Previously your monitors were either disabled or in production with nothing in between. Now you have options. Just open the Main tab on any monitor to adjust the monitor mode.
Development mode: Use development mode to set up your monitor and run manual tests on your monitors. Make all the changes you want and then test some more. Uptrends sends no alerts, and your uptime and performance data goes unaffected.
Staging mode: This is a bit like development mode because it doesn’t affect your uptime or performance data. However, instead of manual testing, staging mode uses Uptrends’ network of worldwide checkpoints—now well over 200—to automate your checks. You can see how your monitors work in the broader network before moving them into production mode.
Production mode: This is the mode you’re used to using. Your monitor is automated on the checkpoint network, and Uptrends includes the test results in your uptime and performance scores.
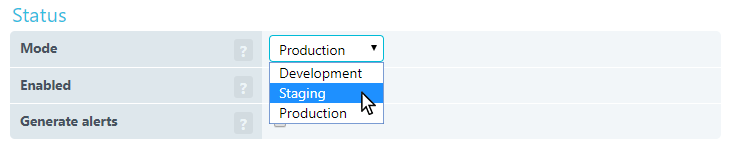
Figure 5: Monitor Modes
Test Now
We’ve really amped up the Test now button. Not only is manual testing more robust, but now you have choices. Previously, your tests were limited to a handful of default checkpoints for your manual tests, and to make it more annoying, you had to pick the checkpoint with each test. We fixed it. We got rid of the default set of checkpoints, and now you have the option to use any of the checkpoints you’ve selected on the Checkpoints tab in your monitor settings. As an extra bonus, while testing a monitor, once you choose a checkpoint to use during your test, Uptrends continues to use that checkpoint for future test until you close the monitor settings. It is a little thing, but we understand how those little things can make your overall experience better.
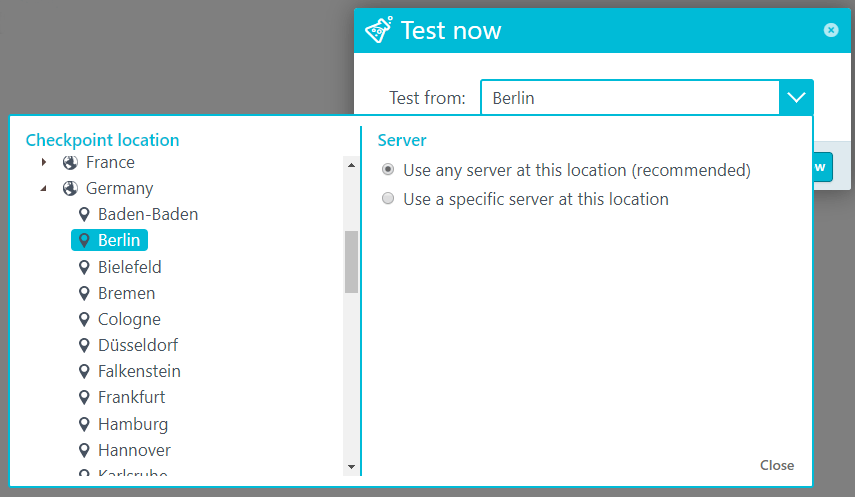
Figure 6. Test now test location dialog
Monitor cloning
Okay, cloning isn’t exactly the right term, but now you can save copies of an existing monitor using the new Save as button. The Save as option is a great way to reuse monitor setups and to establish templates. Save the monitor and then go in and update the URL and name, and in many cases, you’re good to go.
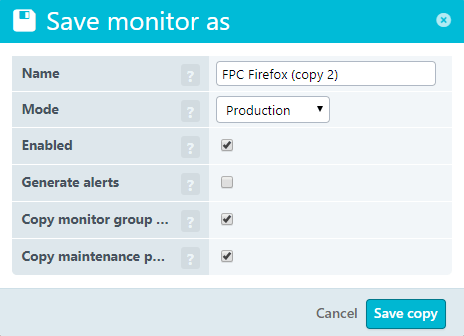
Figure 7: Save monitor as dialog
Operator time zones
Let’s say your company is based in San Francisco (or any other hypothetical location), but you have team members located all over the world. Previously, when viewing reports in Uptrends, those remote team members had to do the math in their heads to switch back and forth between their time zone and the company base. Now, for Enterprise users, your team can view the data based on their time zone. They can also see the time in both time zones when they hover their mouse over a date in Uptrends (see Figure 8).
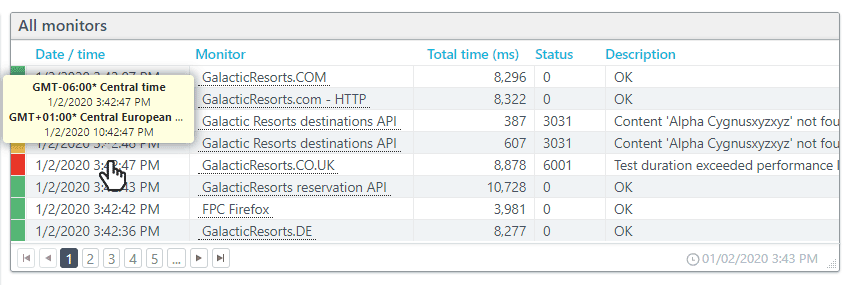
Figure 8. Uptrends Monitor log showing dual time zone.
Maintenance period monitor list
A maintenance period is the scheduled time you plan to take your site down for planned maintenance. You can add maintenance periods to any monitor to avoid unnecessary alerts and negative impacts on your monitoring data.
You’ve had the ability to define maintenance periods for a long time now. However, to check on the scheduled maintenance on all of your monitors required that you open up the monitor settings and check each one. When you have a lot of monitors, which many of you do, that can become quite the chore. Now we have a special menu option where you can see all of your planned maintenance scheduled and the monitors affected. Next time you need to change a planned maintenance period, you can quickly pull up the list and see which monitors have scheduled maintenance setup for them and make the needed changes. The Maintenance periods list makes managing your scheduled maintenance settings much easier. Just click Maintenance periods on your Monitors menu to see the list (see Figure 9).
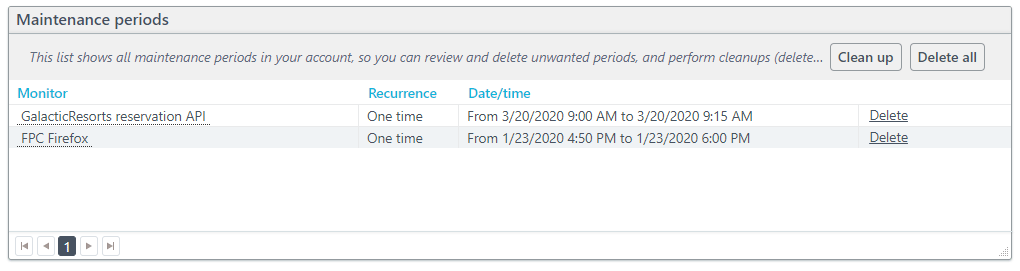
Figure 9. Monitor list with maintenance schedules.
New options for Monitor log exports
You know which data in your Monitor logs that make sense for your needs, and Uptrends shouldn’t decide what to include or exclude in your excel downloads. Besides filtering on monitors, monitor error level, and checkpoints (You could always do all of that in your monitor log), you can now go into the settings on your log tile and pick the specific fields you want to download (see Figure 10). We’ve put the power into your hands.
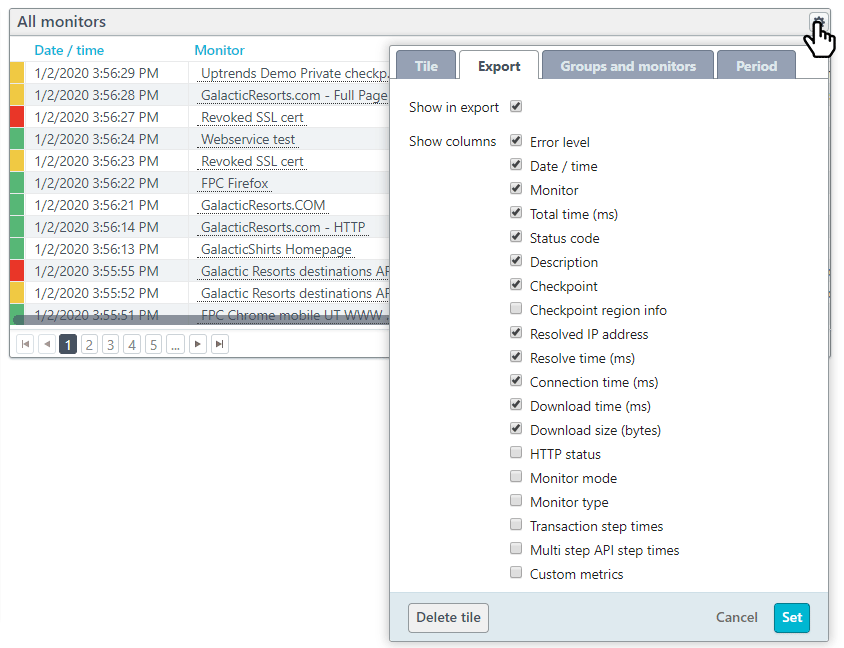
Figure 10. The Monitor log data export settings.
API Monitoring Custom Metrics
Users of our powerful Multi-Step API Monitoring can now define custom Metrics. The feature allows you to extract data points from the JSON or XML data returned by your API. Uptrends stores the data allowing you to track the data in your Uptrends account. Learn more about setting up custom API metrics.
Uptrends API
Our API growth has been insane this year! We’ve added a tone of new functions to Uptrends API v4, and that isn’t going to stop anytime soon. This year alone we’ve added
Monitor Group
Create, update, and delete monitor groups using the Monitor Group API. You can also start and stop, suppress alerting, and add new maintenance periods for all your monitors in the group. Learn more about the Monitor Groups API.
Operator API
You can now manage your Uptrends users (operators) using the API. Create, update, and delete operators as well as maintain their off-duty schedules. Learn more about the Operator API.
Expanded Monitor API
We are constantly expanding the available functions for the Monitor API. Now you can enable and disable monitors with the IsActive field, and you can enable and disable alerting with the GenerateAlert field.
New PATCH method
The new PATCH method allows you to make partial changes to a monitor definition rather than having to provide the full definition using the PUT method.
Looking ahead
We’ve got so much more planned for 2020, and we can’t wait to share all the new features headed your way!