
Ahh, springtime! There’s something about spring that just makes you want to freshen up and take care of those chores that you let slide all winter long. Uptrends isn’t any different. We’ve had a list of things that we would like to do, and just like you, we decided the time was right to dive in and get them done. We’ve been busy cleaning out the dust bunnies and freshening up our error analysis tools with some improvements and new functionality.
To show you the changes, we would like to introduce you to Mr. Monitor. Mr. Monitor maintains the Galactic Resorts website, and he has quite a tough job. Galactic Resorts receives a lot of traffic due to its intergalactic customer base, and it really keeps him on his toes making sure that the site remains available and that performance is still up to intergalactic standards.
Increased reporting period granularity
Each morning when Mr. Monitor arrives at his spacey office, he logs into his Uptrends account to view his data.
When digging in his dashboards, he’s longing to see his reports for just the peak hours. Filtering on specific hours wasn’t something he could do until now, but the improved period selector now allows not just the selection of the day, but the hour as well. Still happy with this new functionality, Mr. Monitor’s smile suddenly dissapears…
What’s that error he’s seeing? By looking at just an hour or two before an event, Mr. Monitor can already see a sudden downward trend in performance before the site failed altogether.
Chart drill down to Check Detail Reports
Whenever Mr. Monitor looked at his charts on one of his many custom dashboards, if he wanted to see the check details that contributed to a particular spike or bar on a chart, he had to open the monitor log and locate the checks in the log to get to the reports. What a hassle! Now, with the new chart drill down functionality, he simply clicks on the area of the chart that he is interested in, and the monitor log opens automatically preloaded with the contributing checks. Let’s zoom in on that error, bazinga!

Error codes and descriptions for humans
Mr. Monitor quickly drills down to the Check Details from his chart and opens the error report. He expected a cryptic error message, but he was pleasantly surprised to find a short description of the error that he could understand. “TCP Connection Timed out”, hmm… While trying to make sense of the whys and the hows, he suddenly notices and clicks a link underneath the error message. The revised Error Types page he arrives on contains detailed information about the “TCP Connection” error, and in this case, the error description also includes possible causes and solutions. The Force is strong with this one!

Sharable check detail URLs
Later in the day Mr. Monitor, busy catching up on paperwork, receives a Slack message from his Uptrends account. Whoops! The Galactic Resorts DNS monitor issues an error. He sees a link in the Slack message… is that a URL to the detailed report for the failed check? Check!
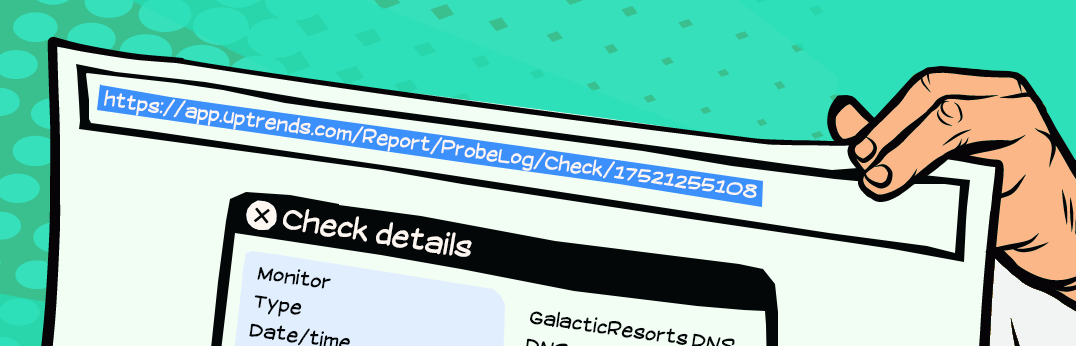
Rather than leave his paperwork, he simply sends the URL to one of his team members with an Uptrends login. The operator can simply follow the link to see the issue without having to find it in the monitor logs.
(Oh, psst: we’ve added links to the check details in your email alerts, Slack alerts, and in the alert details popup!)
Finding the issue in your waterfall report
While having dinner with Mrs. Monitor, Mr. Monitor receives an SMS alert for one of his Full Page Check monitors. It appears that the homepage is testing positive for the term “Page not found.” But, which element made that test fail? He needs to know whom the content belongs to, Galactic Resorts or a third-party content provider. To Mrs. Monitor’s annoyance, he grabs his laptop to pull up the waterfall report to find the erroring element. The first thing he notices is an element in red text. As he brings up the element’s details, he not only sees the request and response headers but the content search results as well. No more guessing from where that content match error originated.
By toggling the new “show domains” link, he sees that the failing element comes from a third-party content provider. He takes it to the third-party provider’s support Twitter account where he tweets them the URL for the failing element, and is back at the table before the mashed potatoes got cold!
See for yourself
We hope you find the results of our spring refresher as useful as Mr. Monitor does, and we hope they empower you to get to the root cause of issues quicker and easier. Log in and try out the new features, and let us know what you think. We love to hear from you!


Leave a Reply