
If you have ever worked retail, you probably know that the most exhilarating and terrifying feeling is the moment when those doors open and the anxious mob rushes in on Black Friday, and too often it is a matter of fight or flight for some consumers and retailers. Therefore, for many Black Friday shoppers, online shopping is the safer and more convenient alternative, and Uptrends was watching.
We aimed our monitors at the big guys (50 of them to be exact), and we tracked their mobile performance, desktop performance, and uptime during the busiest shopping days of the year (get the details). These sites were monitored from all of our 36 US checkpoints (out of our total of 158 worldwide checkpoints). We have included the data for November 24th and 25th, 2016.
According to the National Retail Federation, 154 million people shopped online and in stores during the Thanksgiving weekend, and a large majority of those shoppers used tablets and smartphones to search for deals. According to Adobe, total sales ($3.34 billion) went up by 21.6% compared to last year, with sales from mobile devices accounting for $1.2 billion. That’s a 33% increase from the year before, and Thanksgiving Day’s online shopping totals reached higher than either Thanksgiving Day or Cyber Monday in 2015. It’s safe to say that the importance of mobile website monitoring is increasing.
The uptime numbers
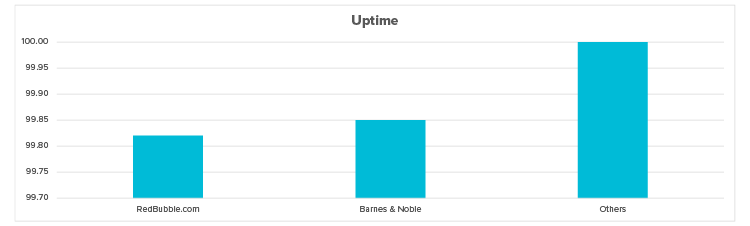
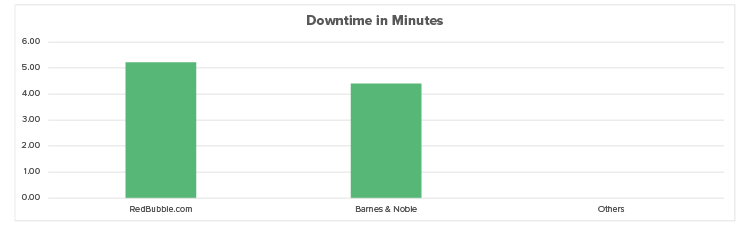
For a site to be profitable, it has to be accessible with uptimes greater than 99.90%. For the two-day period, we saw 100% uptime for all of the monitored sites except for two: Barnes & Noble and RedBubble.
RedBubble‘s site went down on Black Friday at 1:02 PM EST and stayed down for over five minutes.
Barnes & Noble saw sporadic, short periods of interruption. Out of 2875 checks, we counted 50 failed checks. When Uptrends observes a failure, it fires off another check immediately from a different checkpoint to confirm the outage. Two of the 50 failed checks confirmed two outages at 3:39 PM and 3:49 PM on Thanksgiving Day for just over four minutes in total.
Performance: less means more for performance
We all know that speed is king on the web, and if your users can’t start interacting with your page in two seconds or less, you lose a lot of them. We monitored each site for their total load times for both desktop and mobile devices. In our testing, we observed the total page load times using a real Chrome browser in five-minute intervals.
Desktop performance
For our desktop monitors, we used a Chrome browser with a native user agent and speed. Let’s take a look at our top five fastest and slowest sites.
Fastest desktop websites
Many different factors influence page speed including the number of elements, file sizes, and network traffic. As you can see in the table, in general, fewer elements can mean faster load times. iHerb leads the pack in speed with its 49 elements.
| Site | Average Load Time (seconds) |
Number of Page Elements |
| iHerb | 2.67 | 49 |
| Costco | 2.80 | 83 |
| Ulta | 2.93 | 65 |
| CVS | 2.94 | 104 |
| Kohl’s | 3.19 | 98 |
Slowest desktop websites
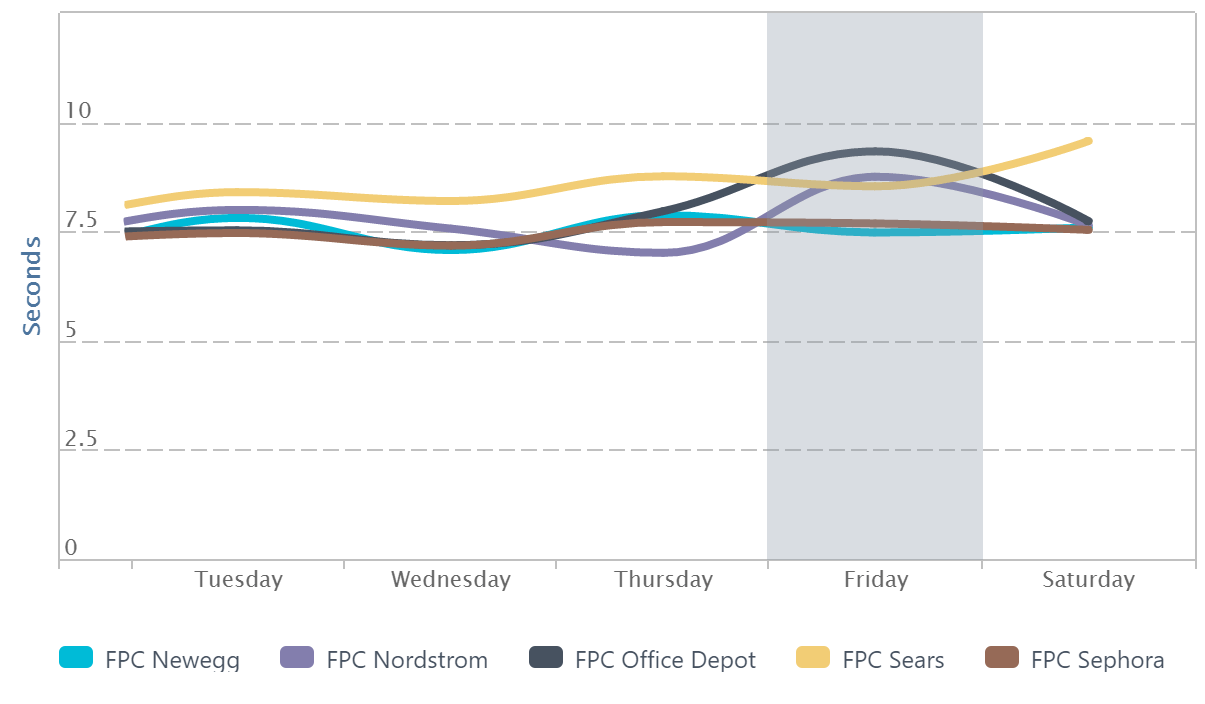
Sears and Office Depot bottom out our list as the slowest loading sites during the two days with average load times of 8.65 seconds. As you can see in the table, both sites have an extremely high number of elements. Besides the high element counts, the performance for both sites suffer from slow response times from their third-party elements.
Nordstrom makes our list of the five slowest sites due to large page elements including video and third-party elements with resolve times of nearly 5 seconds, and Newegg shows poor resolve time on many of their native elements.
| Site | Average Load Time (seconds) |
Number of Page Elements |
| Newegg | 7.67 | 200 |
| Sephora | 7.70 | 288 |
| Nordstrom | 7.88 | 127 |
| Office Depot | 8.65 | 266 |
| Sears | 8.65 | 472 |
We added these fives slowest contenders to a comparison chart, to see how their average load times on Thanksgiving and Black Friday compared to the days before. Two of these sites moved on steady during the holidays. Office Depot, Nordstrom and Sears load times increased on and around Black Friday.
Mobile performance
With record sales of $771 million during the holiday weekend, mobile performance has never been more important, and for that reason, Uptrends paid particularly close attention to the 50 sites’ mobile performance. For our mobile testing, we loaded each site into a Chrome browser using a user agent for an iPhone 6+. We also throttled the bandwidth to 8/1 Mbit to more accurately reflect the US’s overburdened 4G network. The addition of the mobile factor changes the results dramatically for most sites. We’ve placed the desktop speed along side the mobile speed for quick comparison.
Fastest mobile websites
iHerb made the number one slot for the fastest mobile site and the desktop. Working to their advantage is the overall reduced content on both the desktop and mobile sites. iHerb’s mobile site not only has more images, but the receive times suffer due to file size, but they still finish on top. 6PM and HM reduced their element numbers, but long receive times on most elements slows their mobile sites down.
| Site | Mobile Average Load Time (seconds) |
Desktop Average Load Time (seconds) |
Number of Page Elements mobile/desktop |
| iHerb | 3.26 | 2.67 | 73/49 |
| 6PM | 3.97 | 3.32 | 83/60 |
| HM | 4.23 | 3.33 | 102/90 |
| Amazon | 4.42 | 4.18 | 108/156 |
| HSN | 4.60 | 6.35 | 139/201 |
Slowest mobile websites
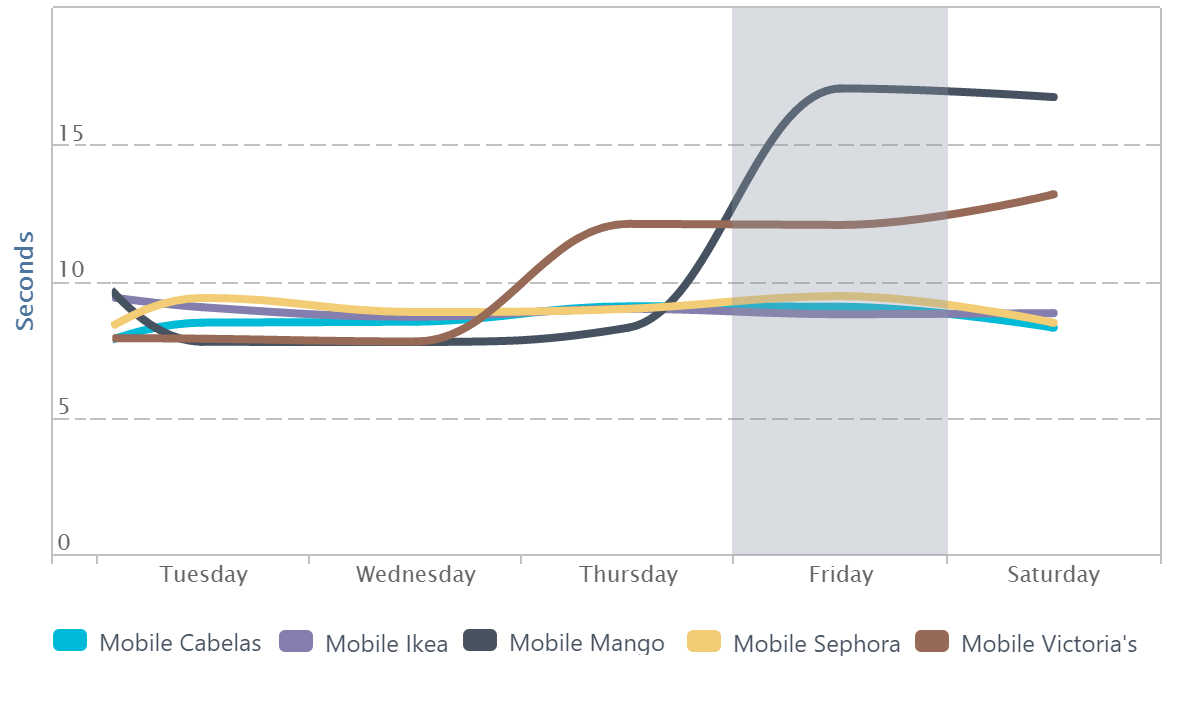
Coming in last, Mango‘s large animated GIF files and other images bog the site down. Some image files on Mango’s site exceed 2MB. Victoria’s Secret makes the bottom five due to excessive content for mobile, slow receive times, and slow third-party content. Sephora made the bottom five of both desktop and mobile for the exact same reasons—a large number of elements. Although Sephora reduced the number of elements for mobile, the slow redirects to their mobile site eat up this time. Cabela’s generally has slow receive times for most page elements, and Ikea has excessively large image files for a mobile site with some images over 1MB.
| Site | Mobile Average Load Time (seconds) |
Desktop Average Load Time (seconds) |
Number of Page Elements mobile/desktop |
| Ikea | 8.88 | 6.23 | 179/183 |
| Cabela’s | 9.06 | 2.67 | 151/250 |
| Sephora | 9.22 | 7.70 | 169/288 |
| Victoria’s Secret | 12.07 | 2.67 | 141/127 |
| Mango | 12.67 | 2.67 | 105/139 |
If we compare pre-Black Friday to Black Friday, we can see that Cabela’s, Ikea, and Sephora performed steadily, while the load times for Victoria’s Secret and Mango went up on Black Friday.
More observations
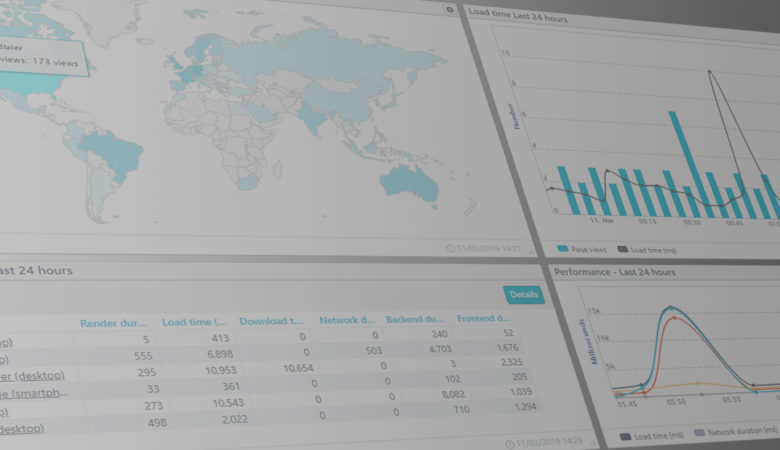
We set up our Full Page Check monitors to gather data on performance on the full desktop version of our 50 monitored sites. The Uptrends Dashboard gives us the opportunity to view the page averages for the 50 sites. For your reference, on Black Friday we observed:
- The average page load time is 3.48 seconds.
- The average page size we measured is 1.54 MB.
- The average number of page elements is 58.
- Of those 58 page elements, 34 are images, which accounts for for 58% of the total page elements.
- The average number of JavaScript files is seven, which accounts for 12% of the total page elements.
Conclusion
Our top 50 sites, as a whole, did really well during the Black Friday shopping frenzy. Every year more people choose to avoid the mobs of people and stick close to home and go online. Making sure each of those site visitors gets the best customer experience requires the diligence that only synthetic external monitoring can provide. Uptime is extremely important, and as you can see from our results, most of the big 50 are on top of it. But where most of them can improve is in their mobile performance. Our holiday monitoring shows that too many elements, large elements, poor CDNs, and sluggish third-party content can seriously degrade the user’s experience.
With external uptime monitoring, performance monitoring, and mobile monitoring a brand can respond rapidly to the ever-changing dynamics of the web. Many of these changes happen outside the server’s firewall, and without external monitoring, your site could have issues that go unnoticed for hours, especially if those problems only affect specific browsers, locations, or devices.
If you have any questions about our findings or our monitors, we would love to hear from you. Contact us, and one of our monitoring gurus will be in touch.


Leave a Reply