
At Uptrends, we care about making the Internet a faster and more reliable platform for all of us to work and play. Optimal uptime and performance is a difficult task for any SaaS provider, but some cloud providers do better than others. When Forbes published their list of the top 100 cloud providers, we decided to put their list to the test.
The top 100 cloud providers
For a complete list of the websites, we encourage you to visit the list on Forbes.com. The list includes a large variety of companies from many different sectors. Some of the top companies include Slack, PagerDuty, Survey Monkey, MailChimp, and Dropbox. Go ahead; check out the list. We will wait.
Our testing methods
For our testing, we aimed an availability monitor (HTTP or HTTPS) and a Full Page Check at the homepage of the marketing website for each provider. We monitored all 100 pages from March 11 through April 19, 2017, using our complete network of 165 worldwide checkpoints.
Uptime results
The desired minimum uptime percentage for any website is 99.99%. Availability percentages at that level are a lofty proposition for sure, but possible. Out of the 100 sites monitored, 77 of the sites managed to maintain the high percentage. In fact, 67 out of the 100 sites managed to maintain 100% uptime for the entire 40 days of testing (see Figure 1).
Uptime
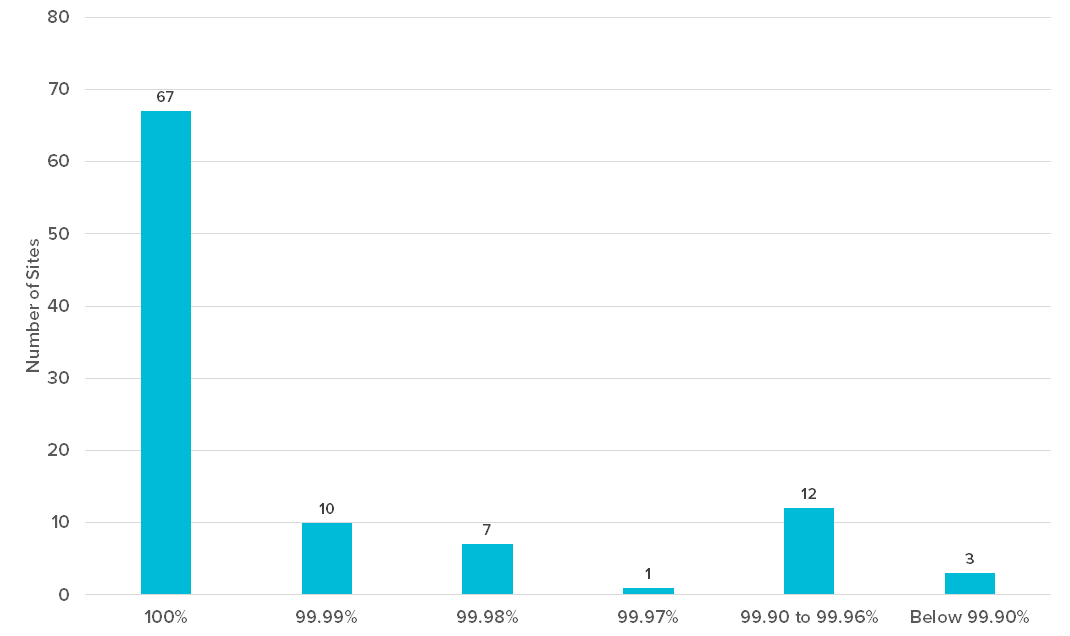
Figure 1. Uptime percentage distribution for all 100 sites
We understand the difficulty of 100% uptime; every site has to perform maintenance, and sometimes things just go wrong. Much of the downtime we observed in the sites with lower availability scores were maintenance related, and we have error screenshots that show that, but downtime is still downtime. Customers rely on a site’s ability to remain available 24/7. Table 1 gives the details of the four sites with the lowest uptime score.
Table 1. Uptime details for the four bottom websites
| Uptime | Errors | Type | Notes | |
|---|---|---|---|---|
| ICIMS | 99.70 % | 172 | DNS Lookup errors | Down for 2.9 hours 3/17/2017 |
| Segment | 99.84 % | 94 | HTTP errors | Down 1.6 hours 3/24/2017 |
| AlienVault | 99.88 % | 19 | HTTP errors | Down 1.1 hours 4/19/2017 |
| Workfront | 99.90 % | 57 | HTTP errors, DNS errors, TCP timeouts |
Down 1 hour over multiple dates |
Performance results
We used Full Page Checks for all 100 cloud providers to monitor the performance of their home pages. We checked the sites once an hour for 40 days. For each check, we loaded a native Internet Explorer browser with the returned content using the checkpoint’s native speeds. Each check provides a detailed waterfall report for each page element. The report gives detailed information for:
- Total load time
- Resolve
- TCP connect
- HTTPS handshake
- Send
- Wait
- Receive
- Timeout
The report also gives the full element URL, element counts, element types, page size, and the request and response headers for each element.
Important: We’re looking at total load times. Longer load times don’t necessarily mean that the perceptive load time of the user is bad as well. By loading elements asynchronously, users might already be well able to interact with a website, having less important elements loading in the background. Taking that into consideration, a load time of 4 seconds might be an expected value, and the Full Page Check allows you to stay in control of this baseline.
The cloud provider’s home pages average 3.65 MB in size. Figure 3 shows the average and median load times for the 100 sites. As you can see, on average, the performance for all 100 sites exceed the recommended two-second load time.
Average and median times for all 100 sites
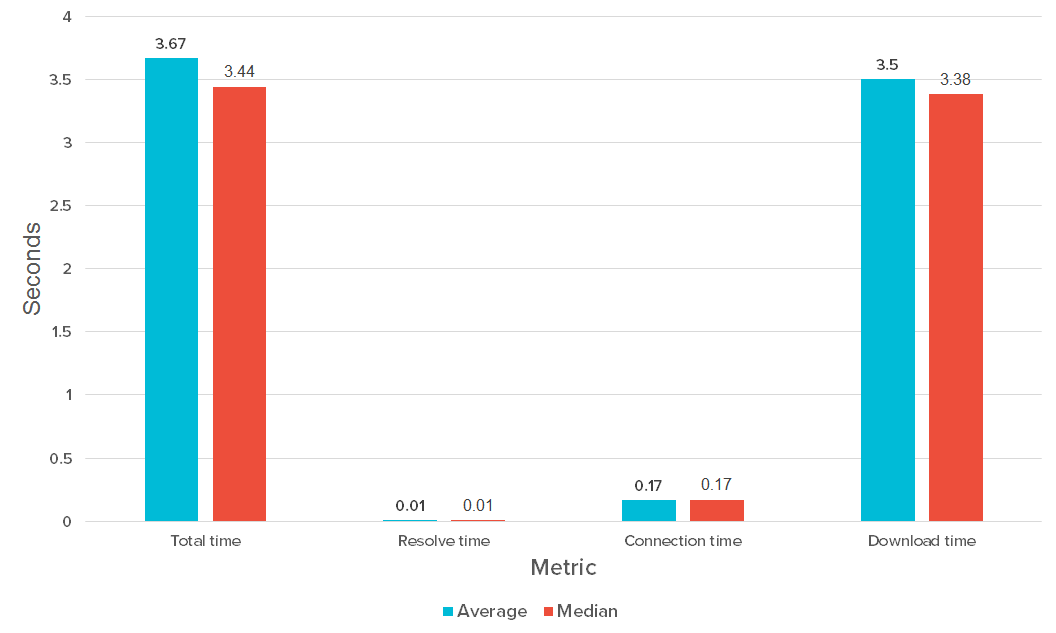
Figure 3. Average and median times for all 100 sites.
The distribution of load times in Figure 4 demonstrates that a majority of sites had total load times in the 3–4 second range. Four sites managed to keep their load times under two seconds.
Distribution of sites based on average total load time
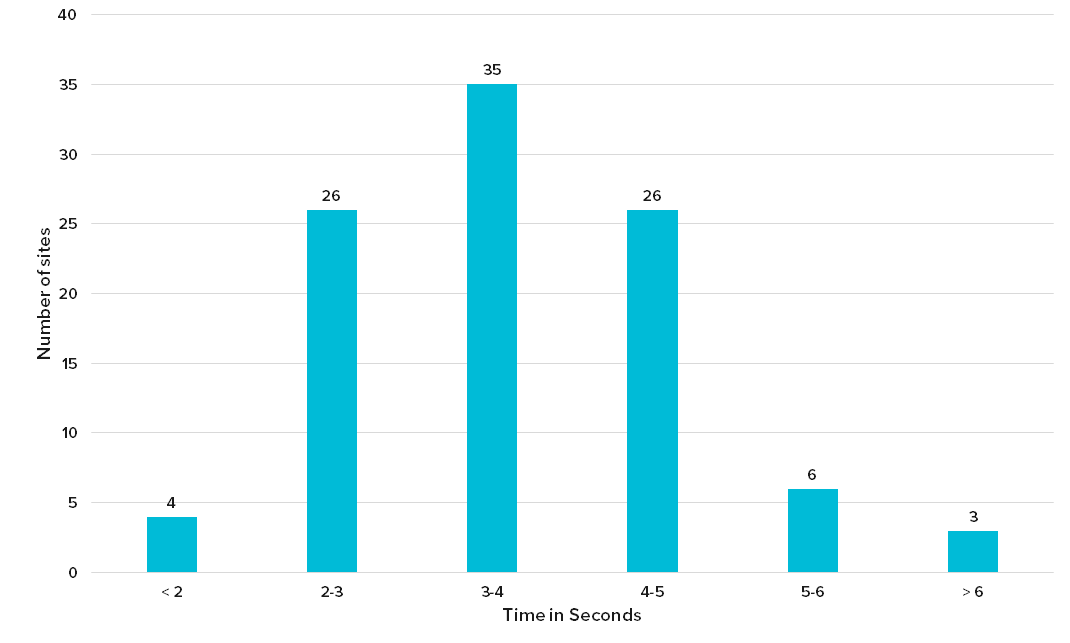
Figure 4. Distribution of load times for all 100 cloud providers.
The top four cloud providers
The four cloud providers that met the goal of average load times under two seconds include:
- GitHub
- Slack
- Automattic
- MailChimp
Figure 5 shows the breakdown for the total load, resolve, connection, and download times for each of the top providers. As you can see, GitHub finishes at the top with a total time of 1.19 seconds. Slack and Automattic tie for second place with a total time of 1.36 seconds.
The top four performing cloud providers
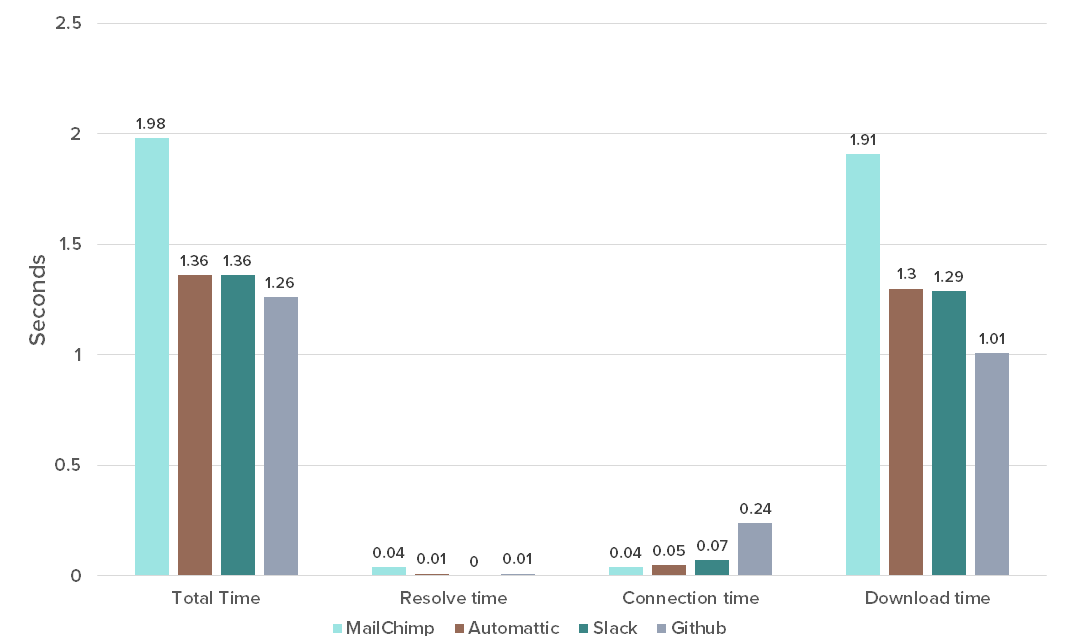
Figure 5. Top four performing sites.
The bottom five cloud providers
The bottom five performers include:
- Anaplan
- Avalara
- Segment
- Talkdesk
- Health Catalyst
Figure 6 shows the breakdown of the average total time, resolve time, connection time, and download time for the five slowest providers.
The bottom five performing sites
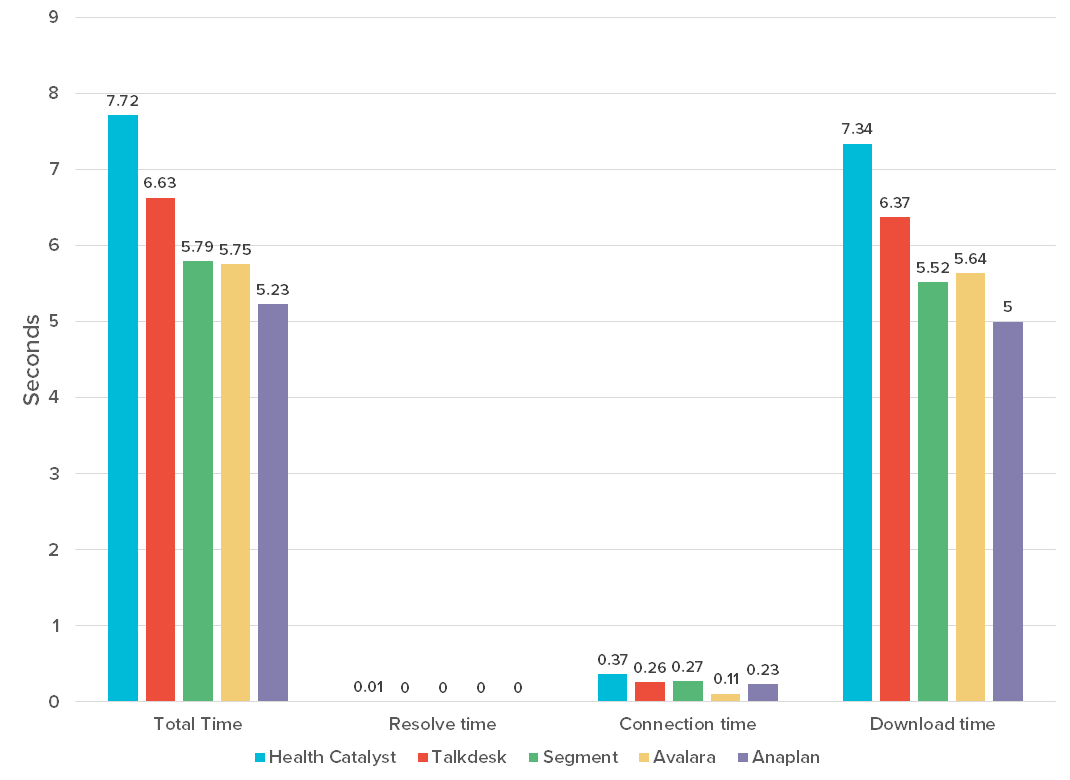
Figure 6. Bottom five performing websites.
Some of the issues we see on the bottom sites include Avalara’s frequently long wait times averaging as high as 139 ms per element. Although Talkdesk has fast response and download times, with 180 page elements with multiple dependencies, the time just keeps stacking up. Anaplan has some slower handshake times, but Flash files with high receive times (61.6 ms on average) ultimately landed them in the bottom five.
Comparing the top and bottom cloud providers side by side
Many factors influence a page’s load times: file size, the number of elements, type of elements, and server and network responsiveness. Putting the data side by side for the top and bottom performing sites is revealing. We took the data for this portion of our report from the last Full Page Check on April 19, 2017, for each site, and we put the data side by side.
Page Size: Does it matter?
Of course, page size matters when it comes to speed, but it is only one factor in the overall performance of a website. When dealing with a slow site, the page size is one of the first factors to consider. As we stated earlier, the average page size is 3.25 MB for all 100 providers. Out of the top and bottom sites, MailChimp’s home page is the largest, but the page still loads in under two seconds (see Figure 7).
Page Size for the top and bottom sites
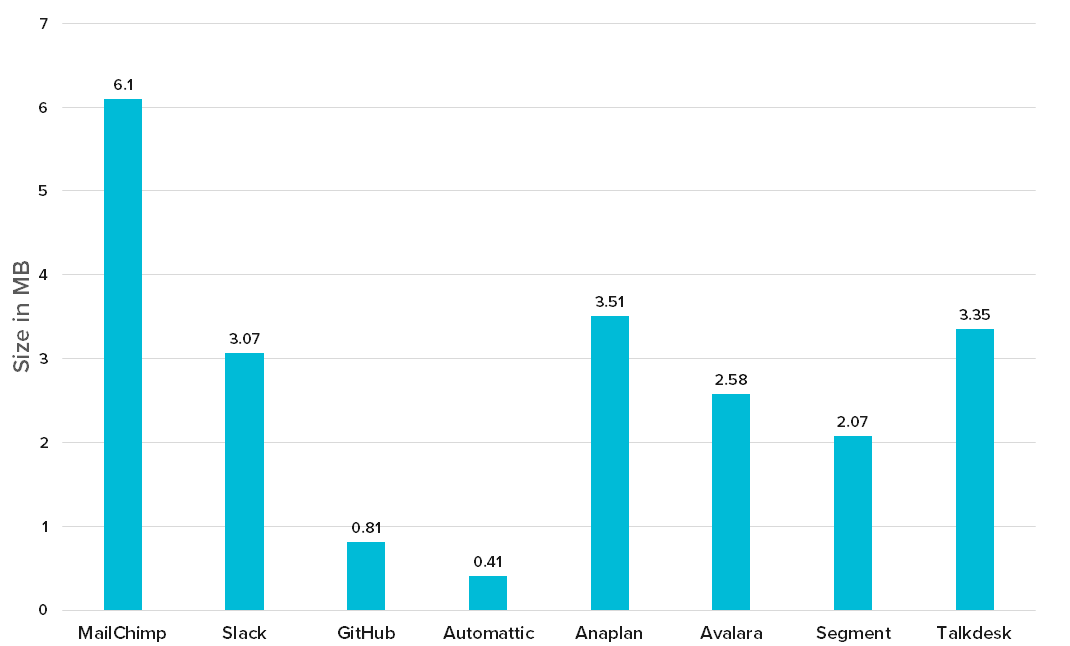
Figure 7. Page size for the top and bottom performing sites.
Quantity does not equal quality when it comes to page speed
The number of elements may be the most striking difference between the top and bottom performing sites. Each request the browser has to make from the server adds time. Precious time that, as you can see in Figure 8, makes a substantial difference in a page’s performance. You can and should consolidate files to reduce the number of requests. The two fastest sites only have one each of HTML, script, and CSS files; the slower sites have as many as 48 script files and 28 CSS files.
Number of page elements
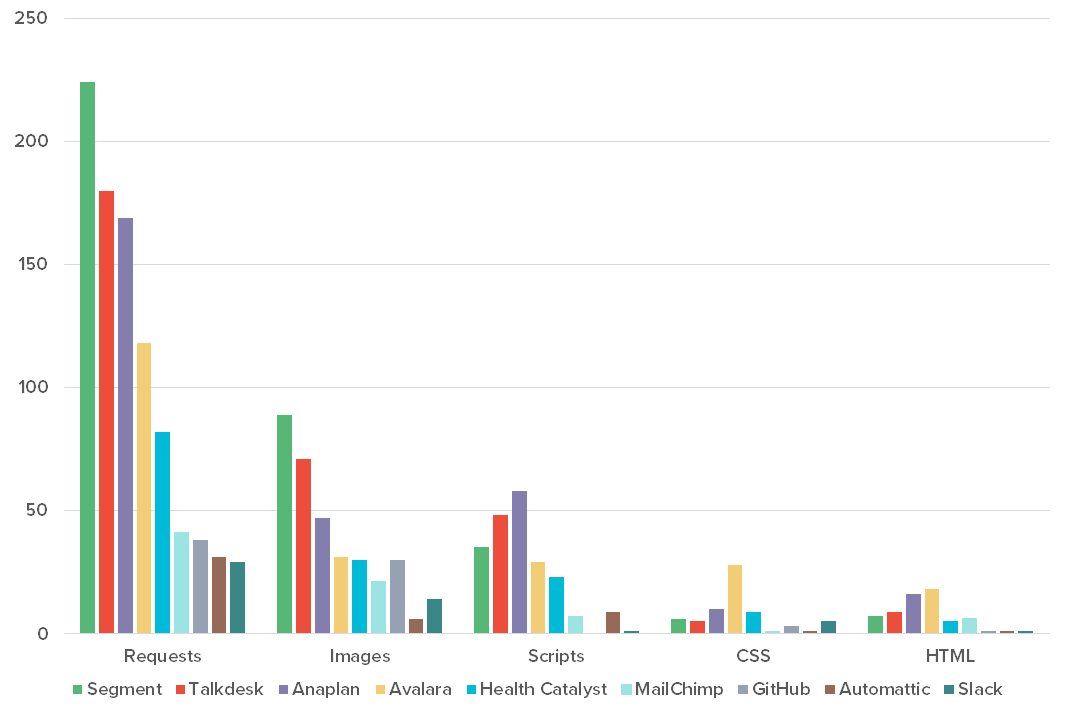
Figure 8. Element count by type for the top and bottom performing websites.
We all have to work together to create a fast, reliable user experience
As a whole, the SaaS industry needs to work on the availability and performance of their websites. Many SaaS businesses also provide services to other SaaS businesses, and their less than stellar speeds reflect in the performance of some of their customers (we’ve seen it). As the Internet’s interconnectivity and dependencies grow, every site, especially those providing services to other websites, needs to improve their overall performance for the industry as a whole to improve.


Leave a Reply