Slow website performance can turn away business, hinder sales, and ultimately ruin your reputation if gone unchecked. One of the best ways to monitor performance is with a waterfall chart, giving you clear insight into what elements are loading slowly on your website. If you have never worked with a waterfall chart in the past, fear not! We will walk you through some of the great things they can be used for.
What exactly does a waterfall chart do?
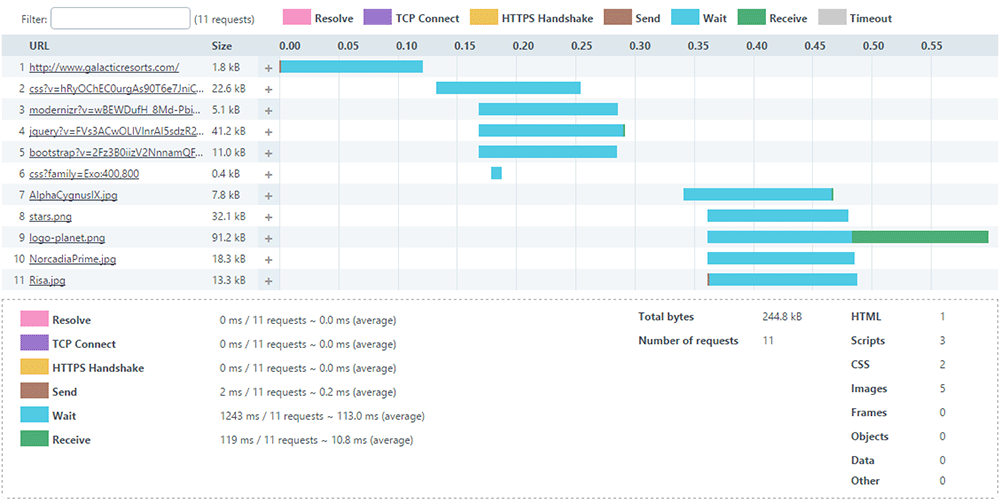
A waterfall chart breaks down and highlights individual pieces of data as they appear in a process. Waterfalls that focus on website performance show every element from the moment they are requested to when they are finally rendered on the screen. A single webpage can contain hundreds of different elements that need to be loaded when a visitor navigates to the site.
Images, scripts, social share settings, videos, and everything else that makes up the page needs to load quickly. A waterfall chart will show you exactly which elements aren’t performing well, allowing you to identify the deficiencies so that they can be fixed. If you have never worked with one before, you can easily start today with a free trial of our Full Page Check.
My page has been running slow for a while, what do I do?
If you have noticed a prolonged latency in your website, or have received complaints from visitors, then you know that the problem needs to be resolved swiftly. The first thing that you need to do is pinpoint exactly where the problem lives. For this task, a waterfall chart is your best tool. Is the performance issue stemming from a poorly optimized third party script, or a slow loading image? Could there be multiple elements that are snowballing together to create poor performance?
These are the questions that you need answers to. Sometimes a single element can create a bit of a digital roadblock, preventing the rest of the page to render correctly. The waterfall chart will show you exactly how long every single piece of data takes to load, from the moment it is requested to the moment it is available and the user can interact with it. A general guideline is that a webpage should be able to load in under 2 seconds. Any longer than that, and you risk having people abandon your website all together.
Can I monitor performance in different parts of the world?
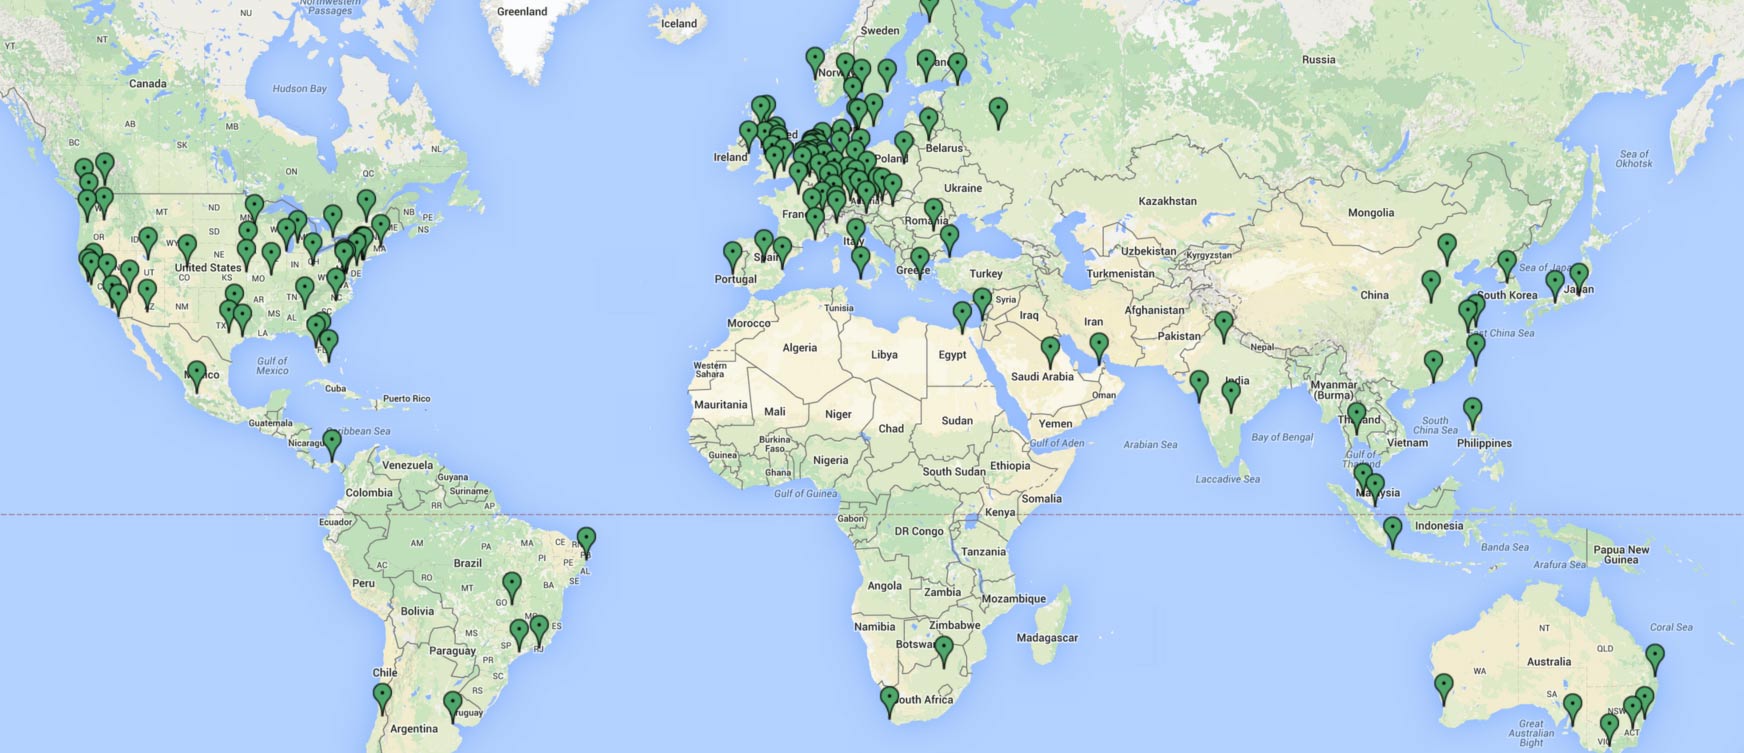
The Uptrends Full Page Check not only generates a waterfall chart for you, but it utilizes our global network of monitoring checkpoints. After selecting a monitoring interval and the checkpoints that you would like to use, our monitors will load your site from different locations. This way you can get a clear view of how your website performs in one country compared to another. If you only get visitors from a localized area, however, feel free to concentrate your checkpoints in that region so that the data you collect is always relevant to your needs.
How many elements are acceptable?
The more elements a page needs to load, the longer it could take. Many e-commerce websites average about 100 elements of data, but heavier websites contain much more than that (the homepage for The New York Times, for example, has about 200 elements). Speed will be heavily determined by the quantity that you have and how well optimized they are. Social share plugins, for example, are great for quickly getting your content out but could still slow everything down by running heavy scripts. Identifying which elements are running slow (including third party elements) is the first step to getting your page optimized and running smoothly.
What are the ideal load speeds?
Like we mentioned above, the industry standard for website speed is under 2 seconds. However, if your site is just 250 milliseconds slower than a close competitor, it is likely more people will choose to no longer visit your website. In the blazing fast wild west of the internet you need to be ready to outpace the competition and provide an online experience that operates at full speed.
The Uptrends Full Page Check can monitor website performance and even highlight how third party scripts are performing on your site. You can use this data to track trends (is my website operating slower at a certain time of day? etc.) and view your performance from different locations around the world. You can try it out today with a 30 day free trial!


Leave a Reply