
Learn about the top 10 most frequent website errors Uptrends encounters. For this article, we took a one-month sampling (October 2020) of all the errors Uptrends catches, and we’ve broken the list down to the top 10 website errors.
Join us as we look at possible causes, and we talk a bit about how to set up your monitors to capture errors more effectively.
Top 10 most frequent website errors
Uptrends makes billions of checks each month. Three percent of those checks result in an error of some type. That doesn’t sound like much, but it actually means that Uptrends identifies millions of outages each month.
The chart below shows the top 10 most frequently recorded errors by Uptrends. Let’s take a closer look at these.
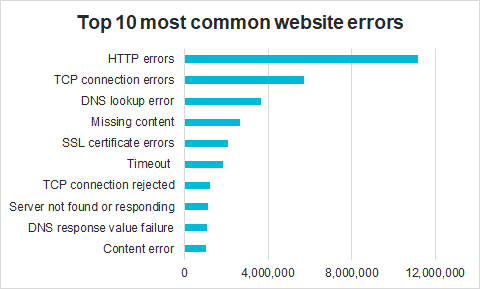
Top 10 errors for the month of October 2020.
1. HTTPS errors
In a single month, Uptrends recorded over 11 million HTTPS errors for its users. HTTP response codes fall into one of five areas with 400 and 500 level codes being failures and 100–300 being informational or instructional.
If Uptrends receives a response code of 400 or above, we record an error (unless you set up the monitor to expect the error). Let’s look at the most common 400 and 500 level HTTP codes.
400 level errors
400 level codes are classified as “client side” errors, but don’t read that as “not my problem.” True, some of these 400 level responses are due to users entering invalid URLs or attempting to access content for which they do not have proper permissions, but issues with your site can cause client-side errors too.
We’ve identified four common client-side errors that may originate with your server:
- 400 bad request. The server refuses the request due to a client error such as request syntax issues, improper routing, or exceeding maximum upload size.
Possible causes and fix: Changes on the server can result in these types of errors. If your synthetic monitoring recieves a 400 bad request response, it’s time to start looking at recent changes that may have caused your monitor and possibly your users to get 400 error codes. Read more about 400 Bad Request codes.
- 401 unauthorized. Either authentication failed or the client didn’t provide credentials.
Possible causes and fixes: if your monitor receives 401 errors, first check the validity of the credentials used in your monitor or stored in the Uptrends vault. Otherwise, failures here may indicate that your authentication process has experienced a failure, such as a database issue.
- 403 forbidden. The client is trying to access resources without the proper permissions to do so.
Possible causes and fixes: if you’re getting the 403 error using your monitor and your testing credentials haven’t changed, you most likely have a configuration issue that blocks Uptrends and possibly your legitimate users. Whitelisting Uptrends’ checkpoints can fix these errors in your monitoring.
- 404 not found. The server can’t locate the requested resource.
Possible causes and fixes: if your monitor has the correct URL and you’re getting a 404 error, something is wrong. Perhaps someone misconfigured a redirect, someone unpublished the article by mistake, or there is a problem in your build process.
500 level errors
The responsibility for 500 level errors fall on you; the 500 level codes indicate that something is wrong on the server side. We’ve picked out some of the most common error codes a user may get back from the server:
- 500 internal server error. Error code 500 is a generic server error used for unexpected or unknown server conditions.
Possible causes and fixes: the catch-all 500 error tells you nothing about what is wrong, just that something is wrong, and the server can’t complete the request—time to start digging into server logs.
- 501 not implemented. If the server doesn’t recognize the request and can’t process it, you may get a 501 coded response.
Possible causes and fixes: A 501 response is often due to an overloaded server.
- 502 bad gateway. A 502 error means a server in the network path returned an invalid response.
Possible causes and fixes: a 502 code is more common when a server acts as a proxy and gets an error response from an upstream server. You will also see 502 codes used to indicate things like a temporary error, server overload error, and a proxy error.
- 503 service unavailable. The server can’t process a request because it has gone down or is overloaded.
The list above is an abbreviated list of common official error codes, but there are many more. Also, you’ll find many unofficial custom codes. Review the official and commonly used custom codes.
2. TCP Connection Errors
When your monitor reports a TCP connection error, it means that for some reason, the user can’t connect to the server, so the user gets a connection error. TCP (transmission control protocol) connection errors may occur with a server outage, or the error could indicate a network problem.
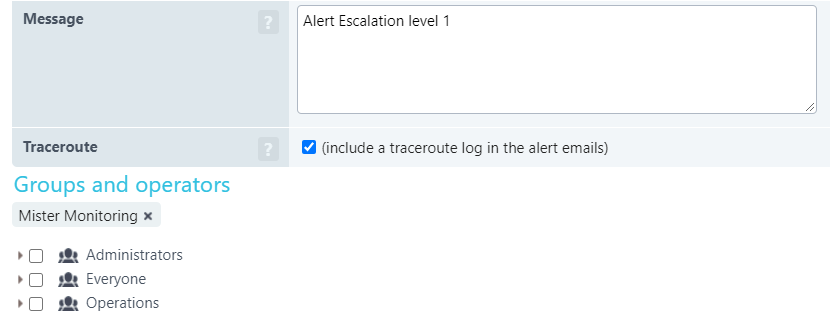
Nearly six million checks during our reporting month experienced the problem. You’ll find traceroutes helpful when troubleshooting these problems. Uptrends can send them to you with your alert by enabling Traceroutes in your alert definition (see figure below). Learn more about setting up traceroutes.
 3. DNS lookup error
At Number three on the list with nearly four million errors in a single month, the DNS lookup error is frustrating. The Domain Name System (DNS) is a distributed lookup service (like a phone book) that matches domain names (yourdomain.com) with the numerical IPv4 or IPv6 address for your server.
You may experience failures globally or regionally due to the distribution of the system. The problem may be due to misconfigured records, a problem with your registration service, or localized outages in the DNS network. Learn more about protecting your DNS.
4. Failed content check
Error codes are great. When you get an error code, you usually know what to fix. For example, a 404 response code means the client found the site but not the page. But if the user gets the wrong page or partial content, the user still gets a successful response code.
You need to know about these silent but serious errors. Using content checks, you can capture these types of errors. Content checks are free checks on the response contents that tell you that something is not quite right even though you got a successful result code.
In one month, Uptrends captured approximately 2.6 million instances of missing content. Let’s look at a few examples of why you should always include a content check with your monitoring.
- The wrong page loads. An error like this may be due to a coding error, a badly set up redirect, or it could be an indication that a hacker has rerouted the request.
- Partial page load. Again, this may be a coding error, a database issue, a network issue, or the result of failing third-party content.
- A blank page. Before users can interact with your site, the browser must render the contents. A blank page may happen due to a server error, scripting error, a network problem, or client browser issues.
Without the content check, you wouldn’t know about these issues until your users start to complain.
Almost every monitor type Uptrends offers gives you the ability to set up a content check. Just choose content unique to the page, and in the case of an uptime monitor, make sure it is content on the initial HTML response.
If Uptrends can’t find your content, we let you know about the problem, and if possible, your website monitor also captures a screenshot so you can see what the page looked like at the time of the error.
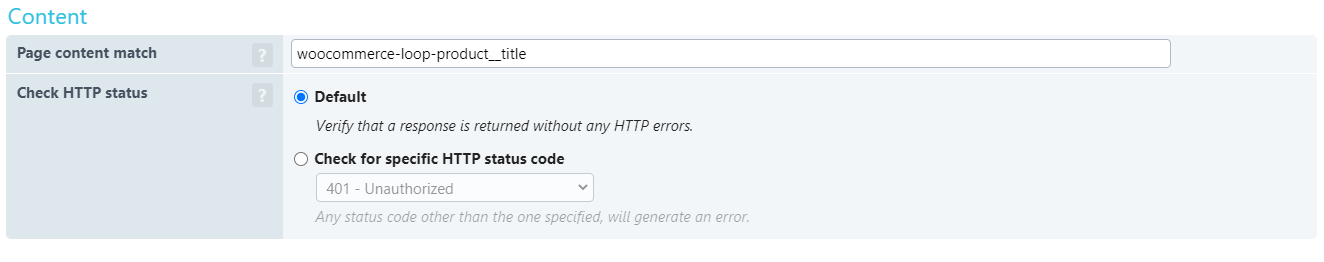
You set your content check on the Error conditions tab of your website monitor. In the example above, we look for a tag attribute in the initial HTML. Learn more about content checks.
5. SSL certificate errors
Certificate errors happen all the time to the big and small websites more frequently than you may realize. In fact, Uptrends tracked over two million certificate errors in a single month. If a certificate expires, is misconfigured, or compromised, the page errors on the certificate, and your users get a browser blocking page telling them the page is unsafe.
Uptrends has two simple ways to check for certificate errors. The first method is to look for certificate errors when conducting your uptime or performance testing (see figure below).
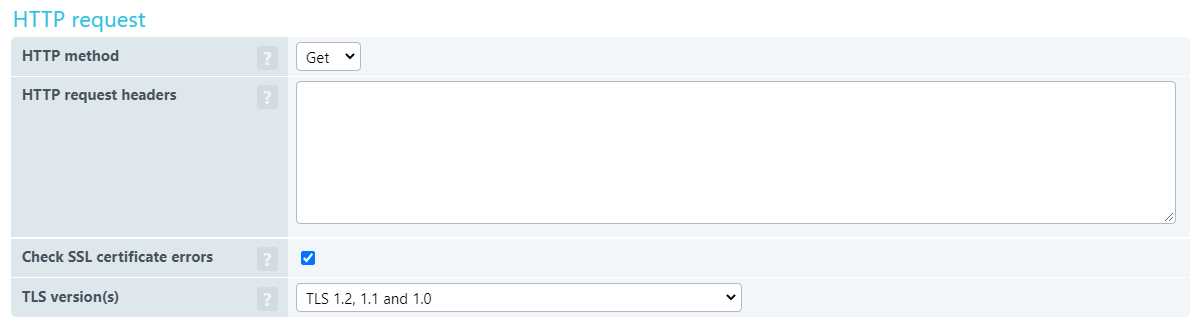
You may also want to use SSL Certificate Monitoring to take your certificate game to the next level. Uptrends sends you alerts about certificate expiration dates, and you can watch certificate values to know when your certificate changes unexpectedly.
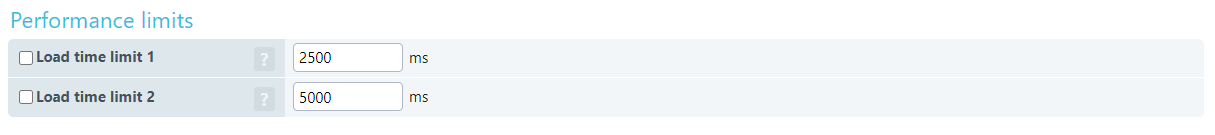
6. Timeout or maximum time exceeded
This error means that Uptrends didn’t get a full response within the expected time.
On the error conditions tab, you have the option of setting the performance limit. These load time limits track the total test time, so for an uptime monitor, the maximum timeout is the amount of time it takes to request and receive the initial HTML response. By enabling and setting these limits, you’ll know when your servers are slowing down or experiencing heavy traffic (see figure below).
7. TCP Connection Rejected
This TCP error is slightly different from the TCP connection error above in that, for one reason or another, the server refused the connection. The rejected connection error may be caused by a client trying to access a service on the wrong port, the port isn’t available, or the firewall configuration denies the connection.
Uptrends recorded 1.2 million TCP connection refusals in a single month. If you’re experiencing this issue with your monitoring, whitelisting Uptrends’ IP addresses can frequently resolve the error.
8. Server not found or responding
If you’ve configured a ping test to make sure your server is findable on the Internet and the test times out, you’ll get this error. In fact, we saw over a million timeout errors in a single month. These errors are due to crashed servers or network issues. Including a traceroute in your alert definitions helps when troubleshooting server not found or responding issues.
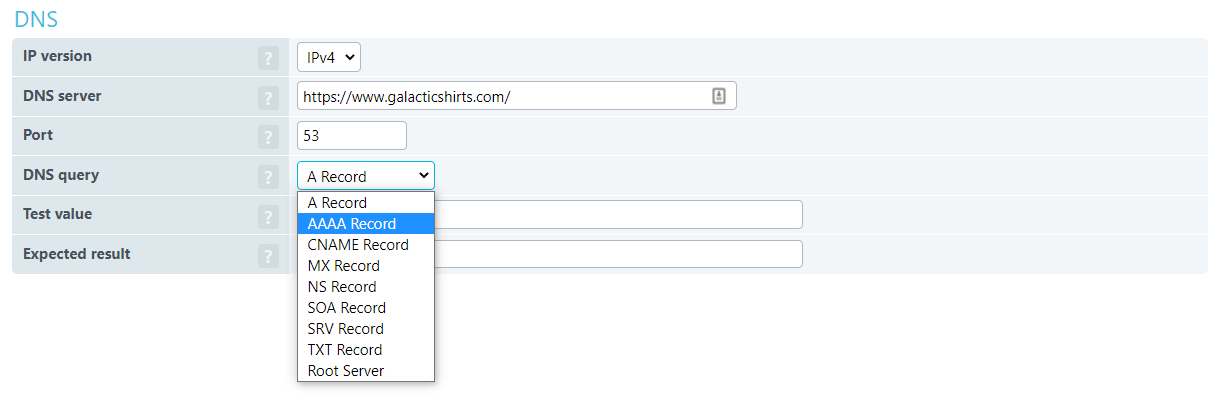
9. DNS response value failure
If you’re using Uptrends’ advanced DNS monitor, you may see this error because the DNS record your monitor checks didn’t match the expected value. You can check one of many DNS record values (See figure below). If a hacker tampers with your records or a change is slow to perpetuate to the entire system, you may see these errors.
We counted approximately 1.1 million DNS response value failures in a single month.
10. Transaction content error
This error is specific to Web Application Monitoring. Like the content checks mentioned earlier, these are content checks that check proper web application progression. Although a transaction error doesn’t translate directly to downtime, if the missing content causes a transaction to stop working properly, you’re actually better off being down. Users are much less forgiving for transaction errors.
Who’s to blame for website downtime?
If your website is returning server errors, most likely, it is due to your provider or your service plan. Therefore, fixing those issues often involve talks with your provider֫—possibly with threats to switch providers—or a plan upgrade. The rest of the problems are pretty much on you.
Ensuring your site is up and responding with correct content is entirely on you even if it isn’t your fault. You have to watch your provider to make sure they live up to their side of the service level agreement (SLA), and you have to watch for configuration issues, coding errors, and hackers on your side of things as well. And a lot of those outages aren’t as easy to spot as a server error.
You saw earlier three examples of issues that don’t return error codes. Unless you’re proactively watching for those issues, they typically go unnoticed until users start to complain. In the meantime, your reputation and possibly revenue suffers.
Uptime isn’t cheap
Maintaining high availability (99.999% uptime) is expensive, and for most websites, it is beyond budget. But even those that can afford the redundant systems (Amazon, Google, Apple, Microsoft) rarely achieve high availability either. Just last week, YouTube lost the ability to stream videos for two hours. The outage took other streaming services down with it. This single outage alone took YouTube’s uptime percentage to less than 99.98 percent for the year. Check out our free Uptime Calculator.
When it comes down to it, you buy the best SLA you can afford, and then you need to pay close attention to make sure they adhere to their side of the agreement. Uptrends has SLA monitoring built in to make tracking compliance a little easier.
Monitoring for SLA compliance
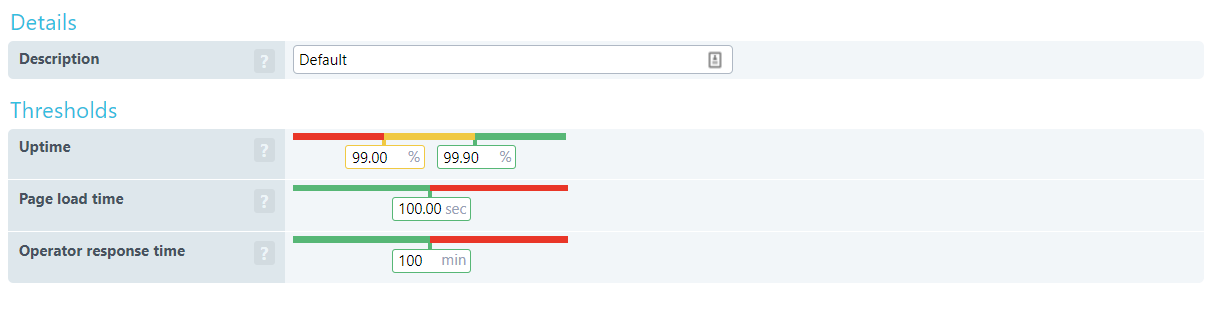
Let’s say you have an SLA with your provider that promises 99.99 percent uptime. That allows for four minutes and twenty-three seconds of unplanned downtime per month. How do you know if you’re getting 99.99 percent uptime? Uptrends’ SLA monitoring is the solution for tracking SLA compliance.
Using an uptime monitor to check on your site for a successful response once per minute, you can track your availability using an SLA definition. Using your SLA definition, you set up outage time thresholds (see figure below). By making regular checks of your SLA overview dashboard, you learn when you’re nearing your expected minimum uptime percentage, and you can easily see when you’ve dropped below your minimum uptime percentage.
Monitoring for outages
As we discussed, your SLA probably only covers outages due to server failures on the side of your provider, but other site failures are all on you. A basic website monitor can capture most 400 and 500 level HTTP error codes. However, unless you use some of your website monitor’s advanced features, other errors can slide right on by unnoticed—that is until users complain. To avoid unnoticed problems
- Use Uptrends’ Website Monitoring
- Enable SSL certificate error alerting
- Add content checks
- Set up maximum response times
- Set up page size checks
- Use SSL certificate and DNS monitoring
Uptime monitoring take away
- You may contribute server outages to your provider, but your users blame you.
- You may find that you are responsible for many client-side errors, especially those that show up in your synthetic monitoring.
- Without content checks, many site issues can go undetected until you notice a drop in revenue or start getting user complaints.
- Advanced availability monitors can help you detect hacks and avoid SSL certificate and DNS errors.
- SLA monitoring gives you the information you need to verify service level agreements between you and your providers or to show compliance with those guarantees you give.