
In case you haven’t heard, Uptrends has a new, exciting free tool, CDN Performance Check. The new tool makes checking on your CDN performance super easy. Plug in a URL for your site or one of your static resources and watch as Uptrends times the connection and download from over 40 worldwide locations. It’s one quick test, but you get so much CDN performance information back.
Setting up your CDN performance check
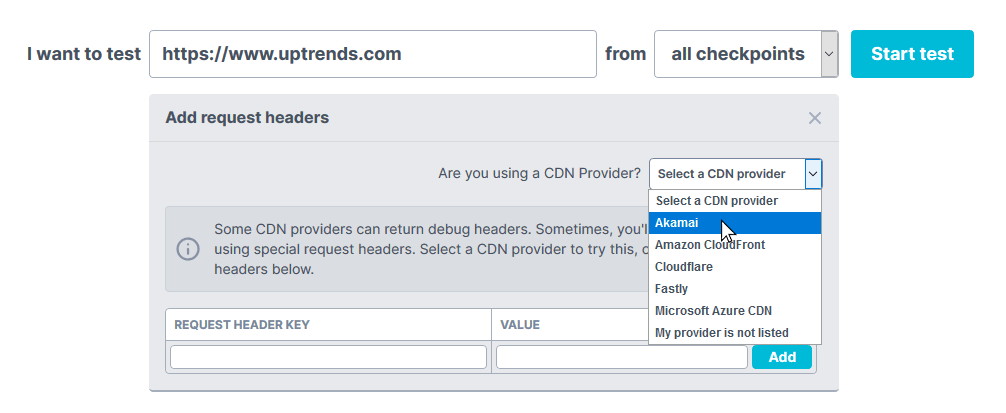
All you need is your site’s URL or the URL for one of your static page elements served up by a CDN. If you don’t use a CDN, but you want to know how well your site does when responding to a request, paste the URL in the domain field.

You can also use your own request headers and specify the CDN provider to get debug headers. You may need to enable debug headers in your CDN configuration when using the Add request headers option.
Interpreting your CDN Performance Check results
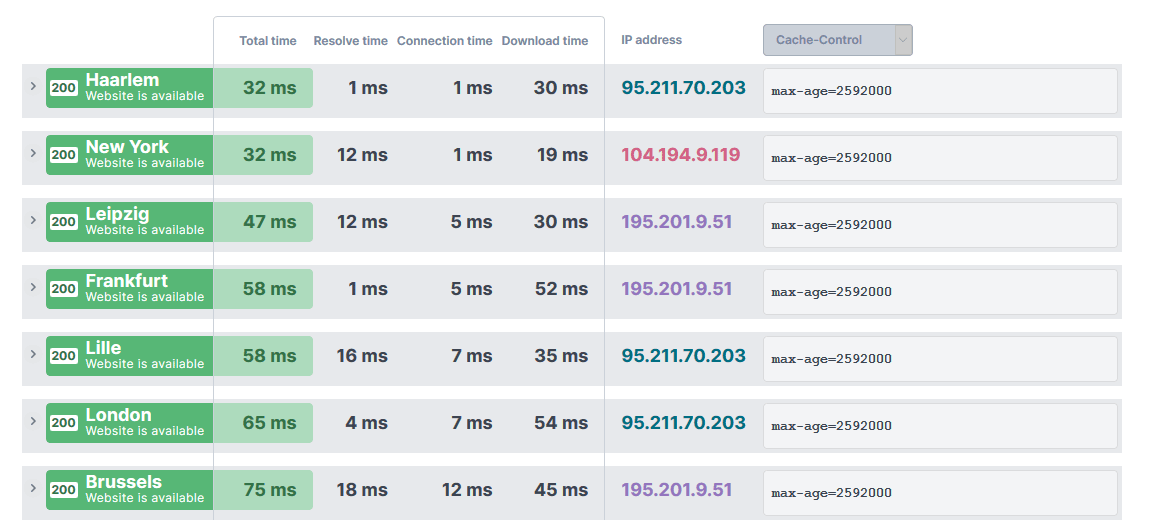
Once you click the Start button, Uptrends schedules your CDN test on over forty of our worldwide checkpoints (fewer if you pick a region). As the results pour in, Uptrends loads them in the order in which they complete.
Total time
The total time metric is the time it took to make a connection, send a request, receive a response, and download the content. The metric is your full response time. Fast total response times are the reason you have a CDN in the first place.
Resolve time
The time it takes to resolve the URL to an IP address. According to Alistair Croll and Sean Power in their book Complete Web Monitoring, a DNS lookup should take no more than 20 milliseconds. Google Public DNS has an interesting write up about DNS latency you might want to explore.
Connection time
The time it takes to set up an HTTP/HTTPS connection to the server. The connection includes the connection request, acknowledgment, certificate, and key exchange for a secure connection.
Download time
The time it took to receive the content once Uptrends makes a connection. Uptrends downloads the content but doesn’t load or process the content in any way. The value is the amount of time from the establishment of a connection until the client receives the last byte of content.
IP address
The free CDN Performance Tool color codes your IP addresses. Matching IP addresses get the same color. If you see all the same color (all the same IP addresses), it is an indicator that your CDN uses anycast addressing and routing. If you see multiple IPs, your CDN uses the unicast method.
What is anycast?
Anycast is a group of computers that share an IP address. All servers have duplicate content, and the routers know the location of the servers. The CDN locates the servers strategically over a wide area, and the server closest to the user responds with the content. If a server does not respond or times out, the router tries the next server in the list. The request may bounce between a few servers before the router finds an available server. The responding IP address is always the same.
What is unicast?
A unicast system has one receiver and one sender. Once the closest PoP (Point-of-Presence) is determined, that server responds to all the client’s requests for content. When a user types in a URL, the DNS provider resolves the IP address, but instead of sending the user to the primary IP, the DNS provider redirects the user to one of the IP addresses in the CNAME records. The DNS provider determines which server is closer to the user based on the user’s IP address. Since Uptrends’ tests originate all over the world, you will see several different IP addresses in your results.
Digging into the CDN response
You also have the option to see specific response headers in the list of responses using the drop-down. Looking at the values in the list is super helpful when trying to figure out if there is a reason for one response to take longer than others. For example, if one of the CDN’s servers has old data, it could affect the response times, so you will want to investigate why content isn’t propagating to the PoPs correctly. You can also expand any response to look at all the header details for the response. The list of available header values is extensive, and every site or service chooses which headers to include. However, sites use some headers more consistently than others. Let’s look at a few of them.
- Total size. The size in kilobytes of the download.
- Status. The code returned by the server.
- Cache-Control. The Cache-Control header is a directive about the caching of the resource. For example, a Cache-Control directive may say if the system can cache a response, and if so, how long can the response remain in the cache.
- Content-Type. The type of media returned, a.k.a. MIME type (Multipurpose Internet Mail Extensions). The MIME type is two parts: the main type and subtype.
For example,- text/ with subtypes such as plain, csv, and html. text/plain
- image/ with subtypes such as jpeg, png, and svg. image/jpeg
- audio/ with subtypes such as mpeg and wav. audio/wav
- application/ with subtypes such as pdf, zip, and exe. application/exe
- Content-Encoding: If any, the type of encoding used on the media-type.
- Expires. The date and time that the browser should considered the response stale.
- Last-Modified. The date and time that the server believes the resource was last modified.
- Server. Operating system information about the responding server.
- X-Powered-By. The technology supporting the web application such as ASP.NET and PHP.
- X-AspNet-Version. The version of ASP.NET that is running on the server.
- X-server. The server’s name.
- Strict-Transport-Security. It indicates that the server only communicates over HTTPS.
- Date. The date and time of the request.
- Content-Length. Size of the response.
- ETag, An ETag is a resource identifier for a specific resource version.
- Set-Cookie. An HTTP cookie.
If you would like to learn more about your response headers, Mozilla has a comprehensive list with descriptions and examples.
Comparing header values across all the checkpoint results can lead you to content delivery problems such as receiving expired content or uncompressed content when you expect compressed content from your CDN.
Checking for latency across your CDN’s network
The whole point of using a CDN is to reduce network latency by physically moving your files closer to your users. If you’re using a CDN, the free CDN Performance Tool can help you find unexpected slowdowns. If the tool finds a slow region, and you know your CDN has a PoP nearby, you could blame the slowdown on a temporary outage or overloaded server causing the CDN to redirect the request to a different PoP. However, when you repeat the test, and the response time is still low, you may need to contact your CDN provider.
I don’t use a CDN, so can the CDN performance check help me?
Sure! Many sites don’t use a CDN, and many of them don’t need to use a CDN. However, a quick CDN Performance Test will also evaluate how well your servers respond to requests. You can see your response times on a global or regional level. If your site performs well in most locations, but not all, you might consider a CDN to serve those areas where your response times need improvement. The tool is a great resource to help you find problem areas. With information from the CDN Performance tool, you can shop for a CDN with PoPs where you need them.
It’s time to test your CDN
The CDN Performance tool is quick to use and full of information about your site’s response times. If you use a CDN, you can see how well it is doing from one PoP to another. The tool is free to use, fast, and comprehensive. Try it! You can also automate your tests using Uptrends Web Performance Monitoring. You’ll get detailed response and load time and header information from Uptrends’ network of over 215 test locations. Try to new CDN Performance tool anytime and try Uptrends for 30 days free. Start your trial today.