When it comes to monitoring your user experience, it is easy to monitor and optimize just the landing pages. But, does your user’s journey end at the landing page? No. Monitoring your user journey goes deep. Each click the user makes on your site or service needs to work and be as fast and responsive as the initial page load. With Uptrends Web Application Monitoring, you can be assured each step in the user’s journey is fast and error free leading to higher user confidence, user retention, and conversions.
What is a user journey?
A user journey is the series of clicks and pages that a user takes to achieve a goal on your website. The user may have many goals once they access your website such as a financial transaction or making a reservation.
Your user’s journey may be quite lengthy such as the one diagrammed below.
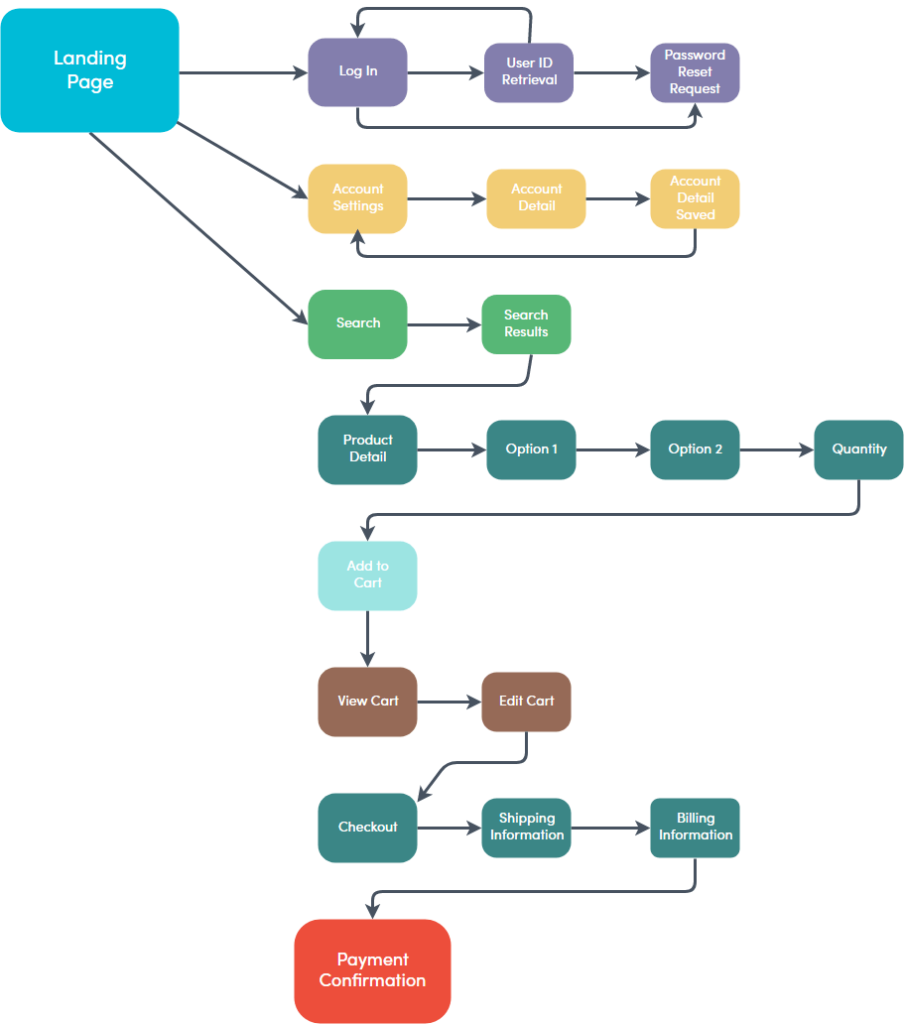
As you can see in the chart above that the entire journey is made up of smaller journeys or transactions, and a user may take multiple routes through your site to reach their goals.
A failure or performance lag anywhere along the user journey will either block the user from achieving their goal or they will abandon the site or service for a competitor with a faster better experience.
Break the user journey down into bite-sized pieces
When it comes to monitoring any user journey, you could set up a single transaction monitor that tests every step in the journey, but the more complicated the transaction gets, the more difficult it becomes to troubleshoot and resolve issues. We suggest you break the user journey down into small functional chunks.
You can break the user journey shown above into five or more separate transactions.
- Login process
- Account maintenance
- Search functionality
- Shopping cart functionality
- Payment functionality
Considering the login functionality, you may want to test the happy path and unhappy paths. Happy paths are user journeys that go as designed without error, and your user finishes satisfied. An unhappy path is when things don’t go well, and the user is unable to complete their intended task.
When a user heads down an unhappy path, the intention is to redirect them back to the happy path. For example, a failed login attempt may have the user to try again by prompting them with an error message. When a user slips off of the happy path, they land in an unhappy path, but with proper design can lead the user back to the happy path with the correct prompts and functionality such as a password recovery option. If any of the password recovery prompts or functions fail, you’ve lost the user probably forever.
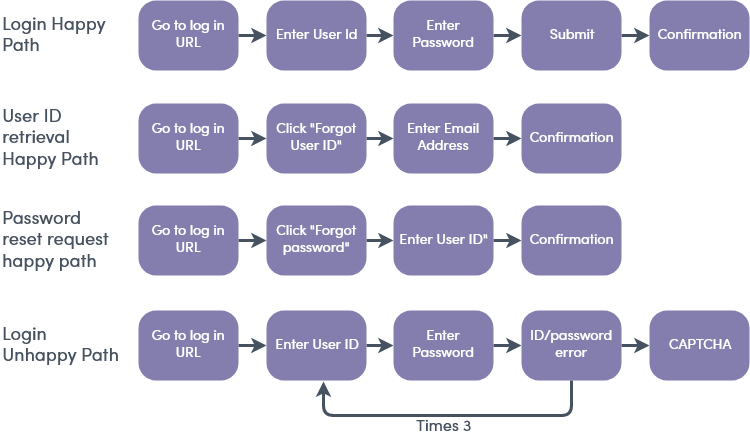
As you can see in the figure below, we have four different scenarios for the login functionality: three happy paths and one unhappy path. The first three paths represent the proper functioning of the login process itself along with the user ID retrieval and the password reset request. The fourth is the unhappy path.
In this scenario, the user keeps attempting the login process but continues to fail. The unhappy path blocks the attempted login with the appropriate messaging and allows three attempts before requiring the user to complete a captcha to proceed. This scenario is important because it monitors the user input error handling and makes an important check on the login security.
Continue mapping out your user journeys. Once finished, analyze each journey and decide which user journeys would impact revenue and brand reputation if they failed. Then consider what parts of your infrastructure those transactions access. In the example above, you may decide that out of the four paths you only want to test the first scenario because it uses the same databases and script files as the other three paths and a failure in one means a possible failure in all the pages.
The unhappy path, may also warrant a separate monitor because it most likely relies on an additional API call. You can also test that API call separately using Multi-step API Monitoring.
Once you’ve mapped out your critical transactions, you are ready to start the transaction recording process.
Use the Transaction Recorder to capture your user journeys
Uptrends offers a simple tool for recording your transactions called (wait for it) the Transaction Recorder—and it is as simple to use as its name! Before using the Transaction Recorder, you’ll need to:
- Download the Transaction Recorder browser extension for your Chrome browser.
- Practice your transaction and know exactly what you will do before starting the recording.
- Keep in mind that once live, a transaction will act like a real person, so avoid unwanted financial transactions, inventory shortages, and bookings. Learn more.
- Add content checks to each page transition to ensure the correct page completely loaded.
- Turn off auto fill; the transaction recorder can’t see auto-filled content.
Okay, are you ready to begin recording? We will use our fictitious travel site, Galactic Resorts for this example.
1. Activate the recorder by clicking the Uptrends icon on your browser window to open the Transaction Recorder.
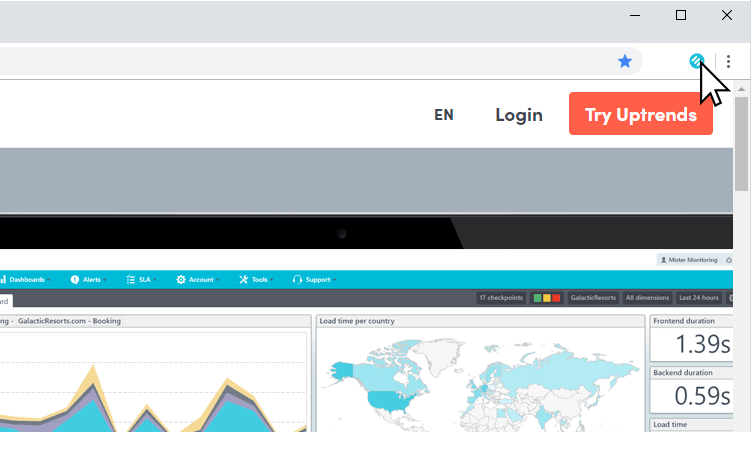
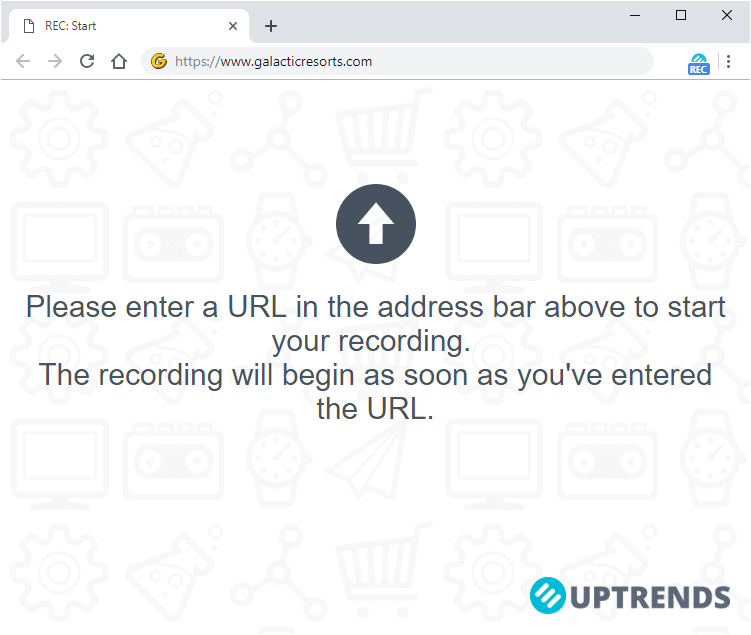
2. Click Start Recording, and a new window opens.
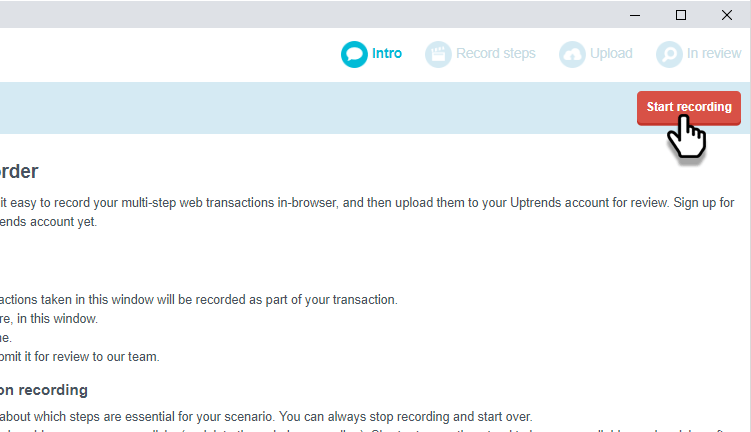
3. Enter the URL in the new browser window.
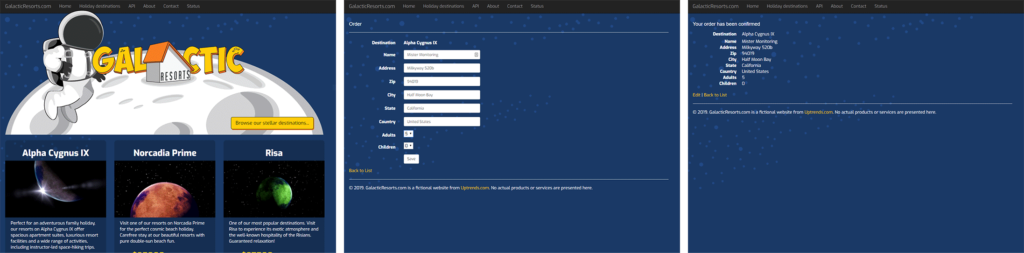
4. Click through your transaction. After each page transition, consider adding a content check by switching back to the recorder page (behind the active browser window) and click Add content check at the bottom of the page. For our transaction We will open the homepage, click Book now on Alpha Cygnus IX, Click Book now on the detail page, complete the form, and click Save. We will add a content check on the last step to make sure we get the confirmation screen.
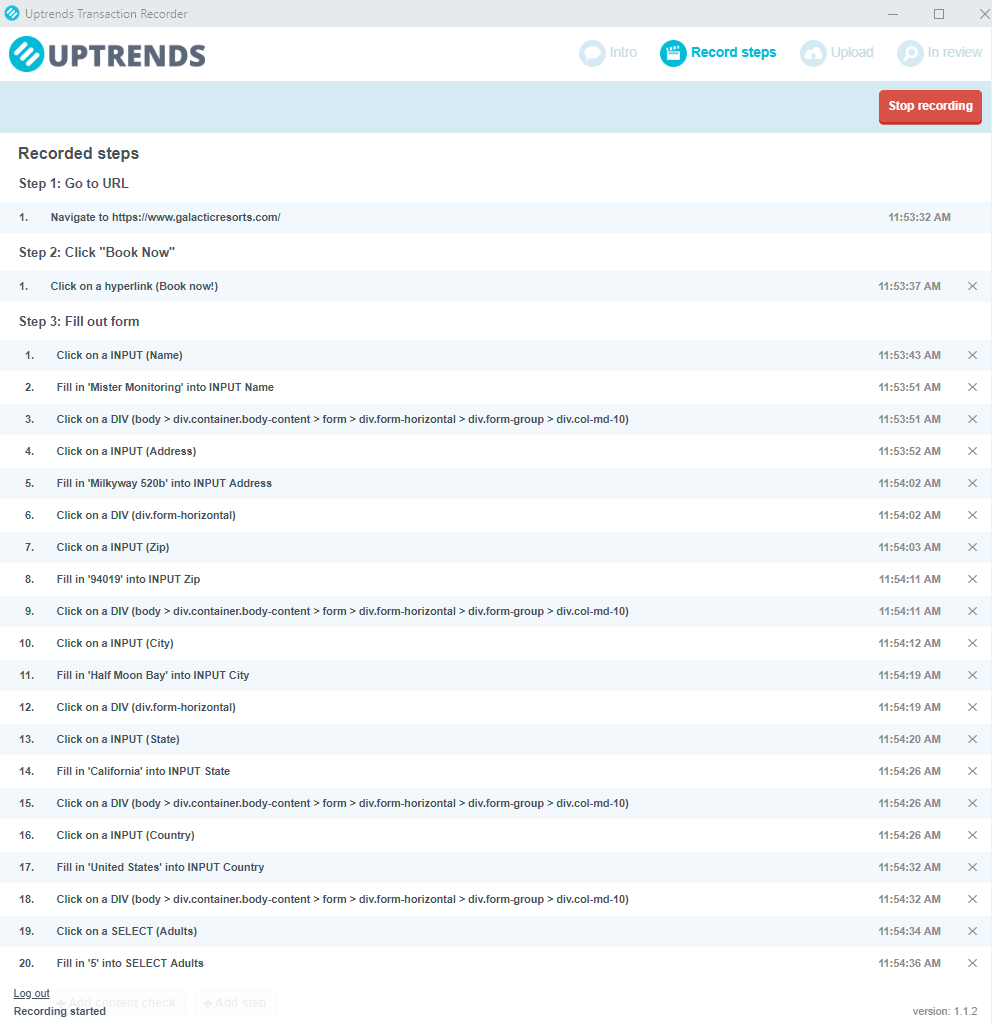
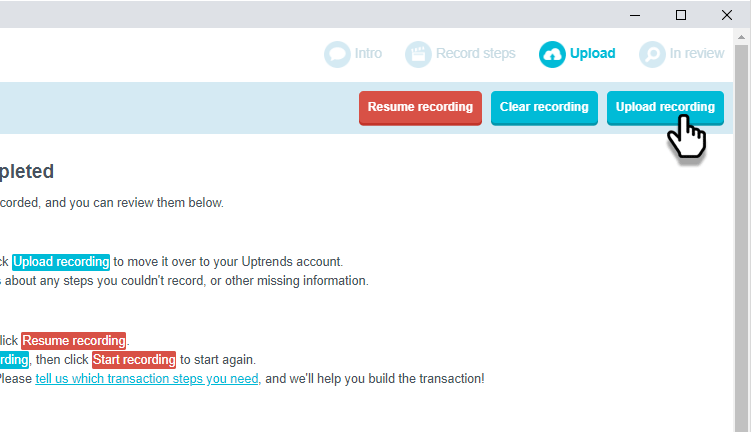
5. Review your recording in the recording window (this may be behind the active page). You can stop the recording at any time, clear the recording, and start the recording again until you’re satisfied (see below).
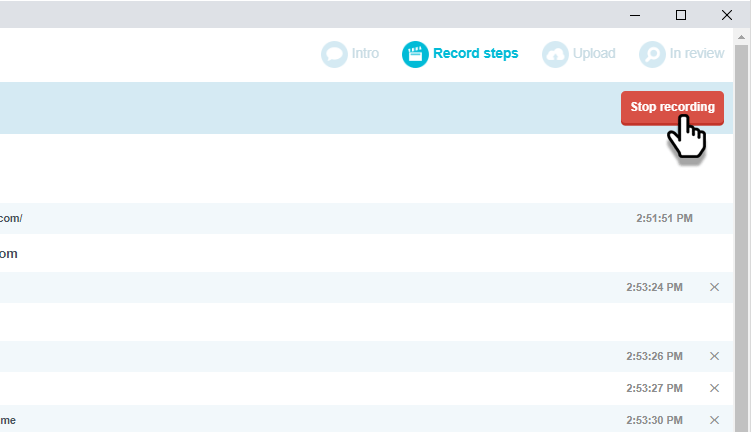
6. Click Stop recording in the upper right-hand side of the recorder window.
7. Click Upload recording to upload the recording to your Uptrends account.
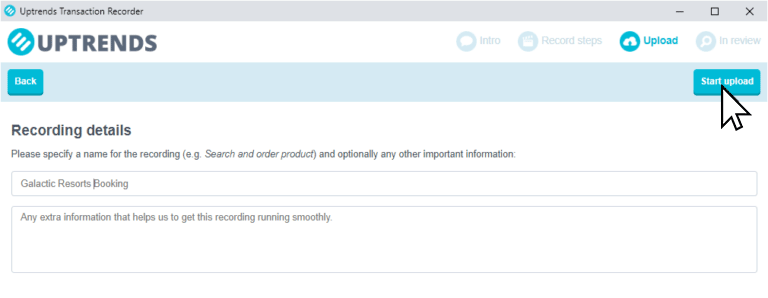
8. Enter a name for the recording and click Start upload.
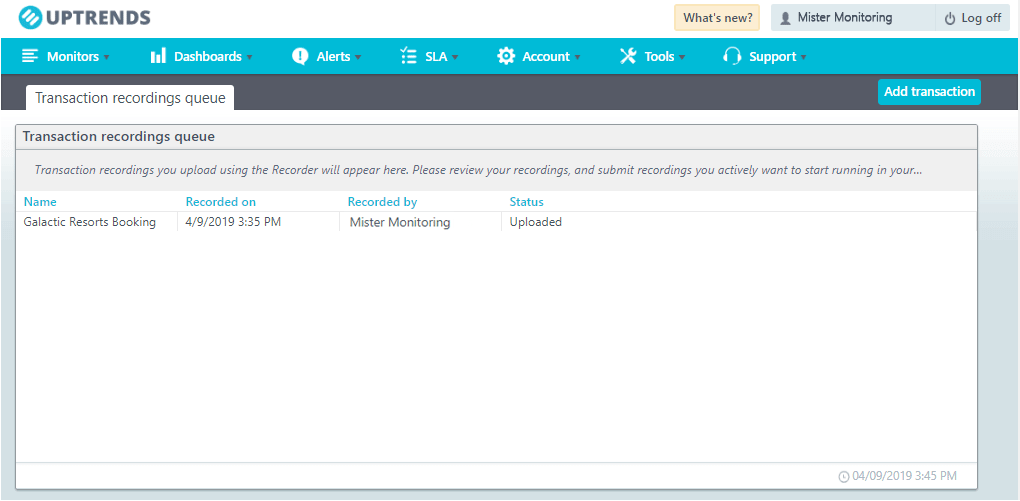
9. Sign into your Uptrends account and open the Recording queue under the Monitors menu.
10. Locate and click on the new recording in the list.
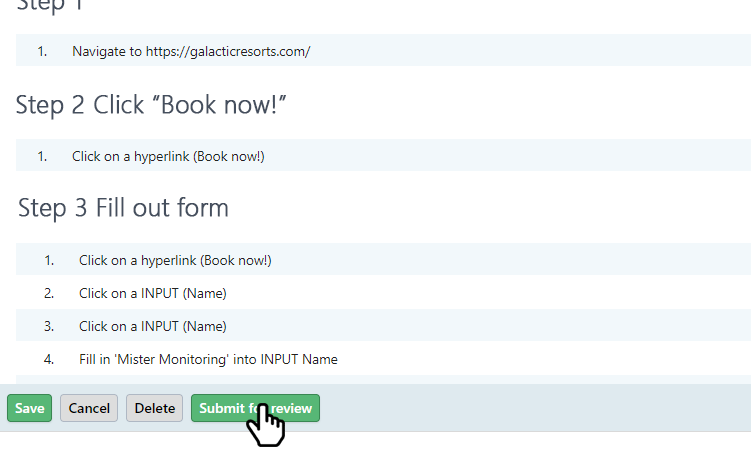
11. Include any comments you would like to send to the scripting pros, and click Submit for review. Learn more about the review process…
That’s it! Once our scripting pros get finished with testing and reviewing your transaction, they will set it up your script as a monitor in your account and notify you that the monitor is now ready for your testing and activation.
A quick note about scripting
We keep our scripting pros on the ready to test and refine your transaction scripts, but for those of you that like to handle scripting for yourselves, we have Self Service Transactions (SST) headed your way soon.
With SST you will have the power to create and modify your own scripts, and if you find yourself in the weeds, our support team is ready to jump in at any moment. The help is always there no matter which method you choose for creating your transaction scripts.
Your Transaction Dashboards
Once you activate your new monitor, within minutes, you will start receiving data. Under the Dashboards menu option, click Transactions to open your Transaction Overview dashboard. We’ve preconfigured your Transaction Overview dashboard to show you the status of all your transactions, the uptime and confirmed errors, the total time for the complete test, and the test logs.
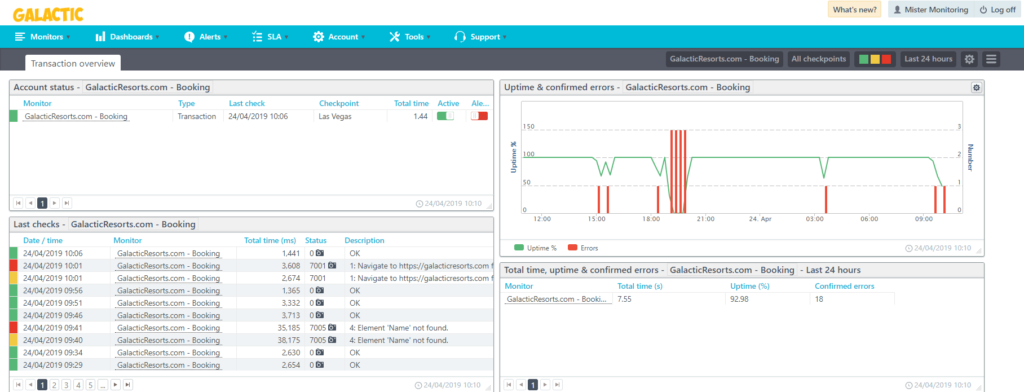
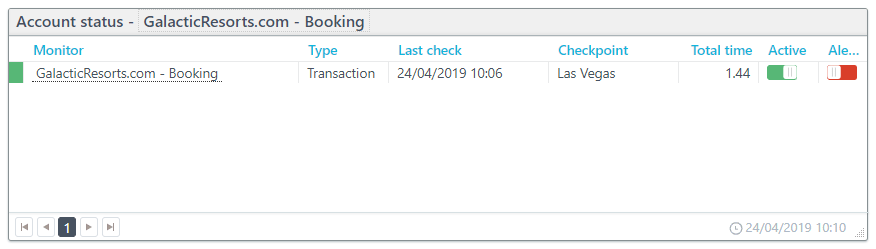
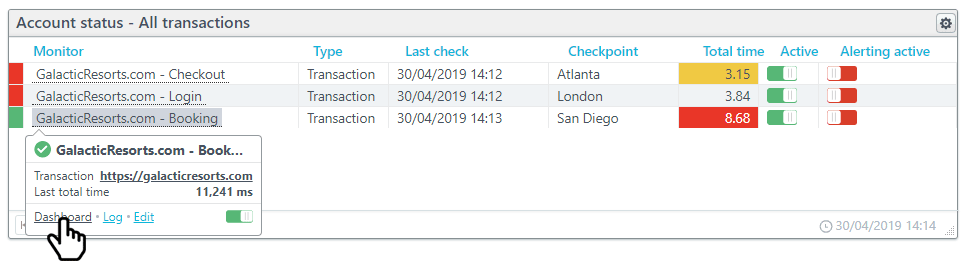
Account status tile
The account status tile lists all of your transaction monitors. The Total time may appear yellow or red if the monitor has experienced recent errors. Clicking on any one row brings up a new dashboard specific for that monitor with more detailed tables and graphs for the step timing and error types.
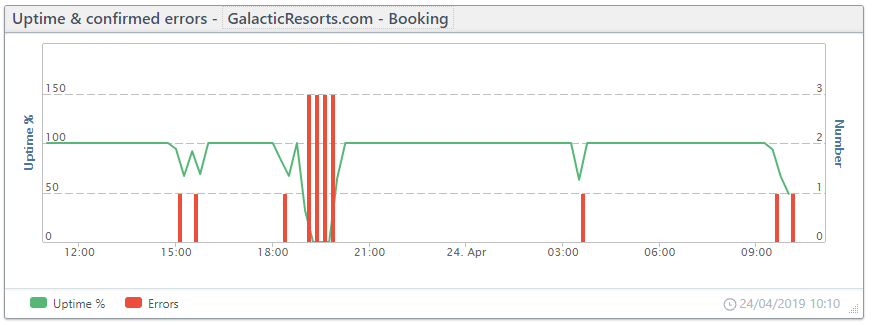
Uptime and confirmed errors
The graph shows you the uptime (green line) and error occurrences (red bars). You can zoom in on this chart by clicking and dragging. Clicking an individual bar or spike will open up a monitor log specific to the error or time clicked.
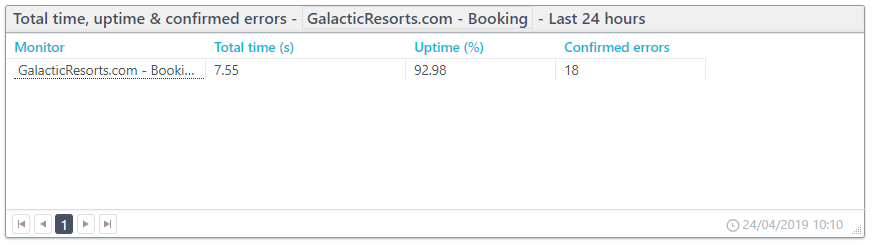
Total time, uptime, and confirmed errors
The tile gives you the average total time that each test took from beginning to end, the uptime percentage for the reporting period and the number of errors that occurred causing the downtime.
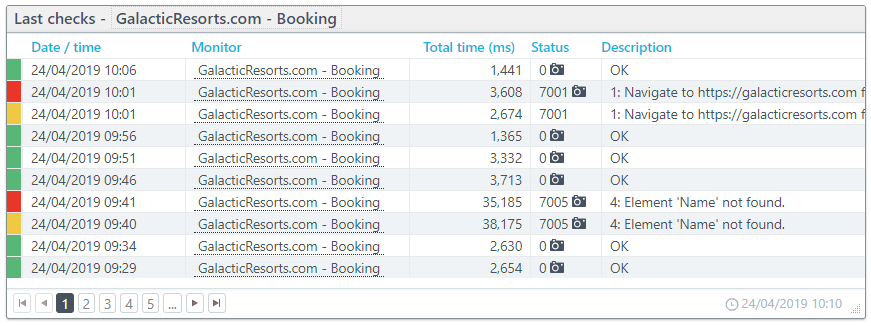
Last checks
The Last checks tile details out the checks with the total time, status (a camera icon indicates the check includes a screenshot), description of the test result, and the checkpoint where the test took place. Clicking on a row brings up the Check Details.
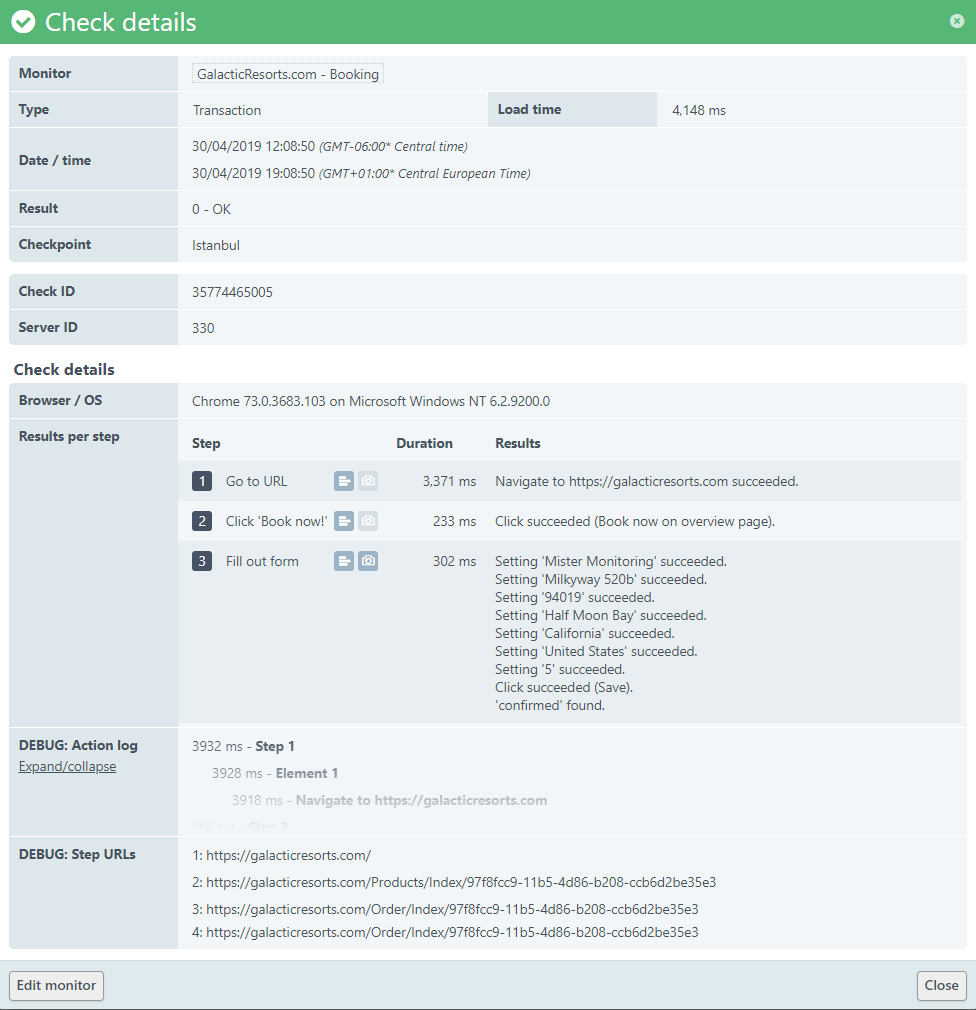
Check detail report
Your Check detail lists out the parameters of the test including date/time, result, checkpoint, browser and operating system used by the checkpoint. The detail report lists out each step with its result and the time it took to complete the test. Expanding the debug section breaks down the time it took for each action within a step.
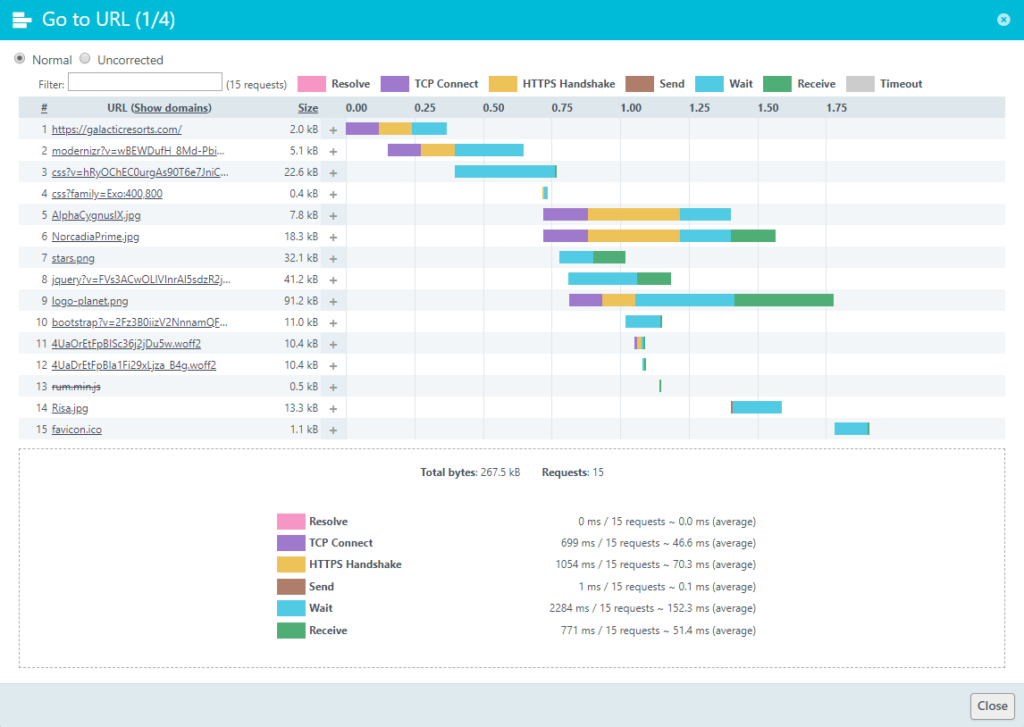
Waterfalls
If you have waterfalls enabled (Enterprise only) for any steps, you can click on the icon to view the results. The waterfall chart below is for the initial page load in step one. The waterfall report gives the timing for each page element’s connection, download, and load times. With each element, you can view the full request and response. Using the waterfall chart, you can identify problem elements and bottlenecks that may slow down your entire transaction.
Screenshots
Screenshots (available on the Enterprise plan) come in especially helpful in the event of an error by allowing you to see the page at load time. The screenshot below was captured during step three of the transaction monitor. The monitor’s content check failed because the content check couldn’t find the phrase “Your order has been confirmed” on the page because the page redirected to the homepage instead of the confirmation screen. The HTML result was 200 OK, so this error would go unnoticed if we hadn’t included the content check on the page.

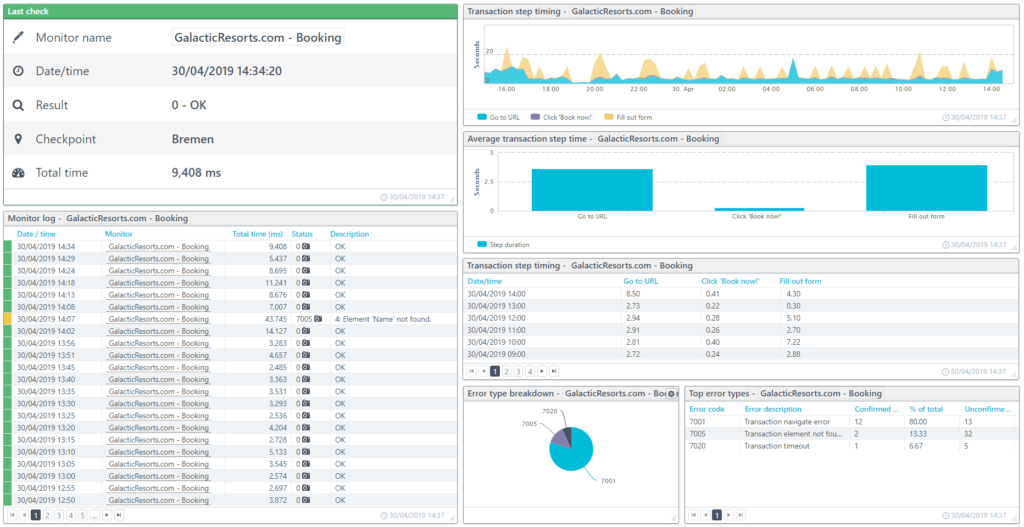
Dig deeper into your transaction data
The transaction overview page is a general dashboard built for viewing all of your transaction data in one place, but from here you can access transaction specific dashboards by hovering over the monitor name and selecting Dashboard.
Your detailed dashboard has information about your step timings in graphical form, and you can see individual step timings in a convenient table format, view error types, and, of course, access your transaction check details in the Monitor log.
Takeaways
- You need to optimize the user’s journey for speed and function from beginning to end.
- Slow loading transactions break user trust and encourage site abandonment.
- Transaction Monitoring can identify performance and functionality problems before your users experience them.
- Waterfall charts can identify transaction bottlenecks
- Content checks can identify user path issues that may not result in a page error otherwise.
- Transaction screenshots can help you get to the root cause of a problem faster.
Want to see a transaction monitor in action? Schedule a demo with one of our Monitoring Consultants.


Leave a Reply