
We’ve introduced Real User Monitoring (RUM), and you may be scratching your head wondering, “How does Real User Monitoring differ from analytics?” That is a great question, and we can see how you might be confused. Well, keep reading; in this article, we show you the differences and explain how Google Analytics and Real User Monitoring work together to give you a broad picture of your user engagement and experience.
What is Google Analytics?
If you need to ask what Google Analytics is, well you probably don’t work in marketing, web development, user experience, search engine optimization, or content curation. Google Analytics has become the go-to product for measuring user engagement since its introduction in 2005. All of the juicy details Google collects on every one of us get boiled down and then applied to bounce rates, page views, conversion rates, click-through paths, and page duration, just to name a few metrics. All of that data enables brands to improve SEO, navigation, page layout, and content on their pages to make it more enticing for the user and help them achieve their brand’s goals.
What is Real User Monitoring?
Real User Monitoring isn’t as commonly known as Google Analytics is. Real User Monitoring, like Google Analytics, measures each user’s experience on your page from strictly a performance perspective. Real User Monitoring breaks down all the connectivity and download times for each user, aggregates the data, and allows you to view your site’s performance based on user location, browser type, operating system, and device. A Real User Monitoring user may very well include the same professions as Google Analytics, but it crosses over to DevOps and network engineers. Although the analytics audience can often respond to content related performance issues such as large file sizes, they often are not in the position to do much about network and server configurations. System engineers use Real User Monitoring data to improve load balancing and identify other network and infrastructure issues. For example: the interactive chart below allows RUM users to compare load times visually on a worldwide or regional level.
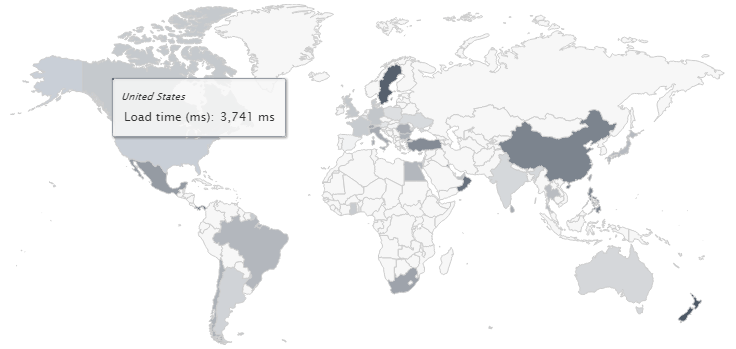
Interactive world map showing average load times at the country level. Darker shading indicates longer load times.
Real User Monitoring versus Google Analytics
Both Google Analytics and Real User Monitoring give you analytics about users’ locations, devices, operating systems, and page views, and both give you performance metrics. So why use Real User Monitoring when Google Analytics is free? In a nutshell, Google Analytics is a wealth of information about user engagement and light on performance, and Real User Monitoring is rich with performance data and light on the analytics. Let’s take a closer look.
Data sampling
Google samples your data, and the sample sizes vary based on the type of information you need. You can learn more about Googles sampling methods on the Google Analytics site. Using data sampling is a valid method for approximating results, especially in large data sets when you need a general idea of how something is doing, but when you need to take a close look and get data based on a small segment, sampling doesn’t cut it. With Real User Monitoring, based on your plan options, you can get the entire data set. With the entire data set, you can see all of your users including those on less common devices, browsers, or in less densely populated areas.
Real-time versus historical data
When it comes to monitoring user experience versus user engagement, time is a factor. When your users experience slow performance, you want to see it right away and not wait to discover it. Google Analytics only has a small subset of reports in real time, and Google does not include performance metrics in the real-time reports. We can’t determine Google Analytics’ actual latency, but at best, it is probably a couple of hours. Real User Monitoring starts updating your dashboards within minutes of your users accessing your pages. Of course, you can also view your Real User Monitoring data from a historical perspective, but when you need real-time data, Real User Monitoring delivers.
Median versus Average values
A few outliers in any data set can really skew your reports, especially in performance data. To help alleviate the effects of extreme values on the data, we’ve made the median or middle value the default for representing your performance scores. You can easily switch to using the average values, and with Uptrends’ customizable dashboards, you can show both the median and average values side by side. Google Analytics doesn’t offer the user the opportunity to select the method used to calculate the mean.
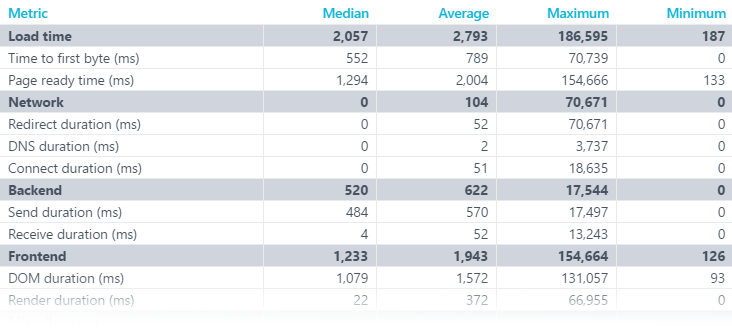
The Metrics table, located on the RUM Performance dashboard displays the median and average along with the minimum and maximum values.
Data and dashboards
Google Analytics designed its user interface for user engagement reporting that focuses more on user demographics than site performance and user experience. When looking at performance metrics in Google Analytics, you may find it difficult to get to your data let alone get data in a meaningful way. We designed Real User Monitoring’s interface with performance and user experience in mind. Our default RUM dashboards make it easy to get your data at a glance with comprehensive drill downs just a click away. You can also create your own custom dashboards. Custom dashboards let you get your data your way; you can even put Real User Monitoring and Synthetic Monitoring results on the same dashboard.
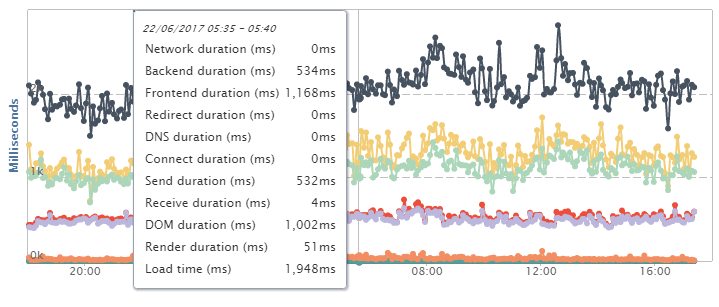
One of the many different interactive charts found in the RUM dashboards.
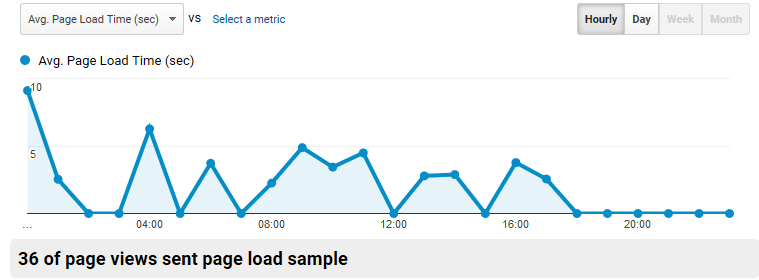
Google Analytics displays one metric per chart with this chart showing load time for a single day. Notice the sample size is 36 page views out of 2945 total page views.
Setup
If you have set up Google Analytics, you already know how to set up Real User Monitoring. Both use a small script unique for your site that you add to the head tag on your webpages. When a user accesses the page, the script loads asynchronous to your page content and does not interfere with your page’s performance. Both tools gather data and send them securely to the cloud in the same fashion. You can get more information about setup and privacy concerns in our Knowledge Base.
Conclusion
Google Analytics is an amazing tool for monitoring user engagement; we use it. You will not replace Google Analytics with Real User Monitoring. Nor can you count on Google Analytics to give you the detailed performance data you need to assure every user gets the same quality experience. Real User Monitoring used in combination with Google Analytics gives you the entire picture from both engagement and performance perspectives. Uptrends’ Synthetic Monitoring, Real User Monitoring, and Google Analytics combined create the monitoring trifecta! Try Real User Monitoring free! No credit card or commitment required.


Leave a Reply