
We are proud to present a user friendly and clean interface with you to work with as you monitor your website or web service. However, that doesn’t mean we don’t have a few tricks you could try to make your experience that much more positive. From helpful keyboard shortcuts to duplicating entire dashboards of helpful data, we’ve got you covered with these 10 easy tricks.
1. Short keys
No one has time for full length mouse clicks and desktop navigation; sometimes you need a quick keyboard shortcut to get things done. Start out by trying these to speed things along and give you more control over your content.
![]() Press F to toggle full screen
Press F to toggle full screen
Want to see more of your dashboards and monitors? Pressing the F key will toggle the full screen function, eliminating the menus at the top of the Uptrends page. Hitting the F key again will disable the feature.
![]() Press F11 to go full screen in your browser
Press F11 to go full screen in your browser
If you’re going to be spending some time looking at your Uptrends data, anything else on the screen is just a distraction. Hide your search bar, bookmarks, and the rest of your browser by pressing F11. When you’re finished, you can return your browser to normal by pressing F11 again.
![]() Press E to toggle error filter
Press E to toggle error filter
If you’re trying to look at a lot of monitors it can be easy to get bogged down in the data. Filter exactly what types of errors you want to look at by pressing E. A small menu appears allowing you to filter between confirmed errors, unconfirmed errors, and everything. To hide the menu, press E again.
![]() CTRL + Click on the save button to stay on the same screen
CTRL + Click on the save button to stay on the same screen
Are you continuously editing the settings of a monitor and want to save, but wish to continue working in the monitor? By holding down the CTRL key and clicking on the save button, Uptrends will save your changes but not navigate you away from the page.
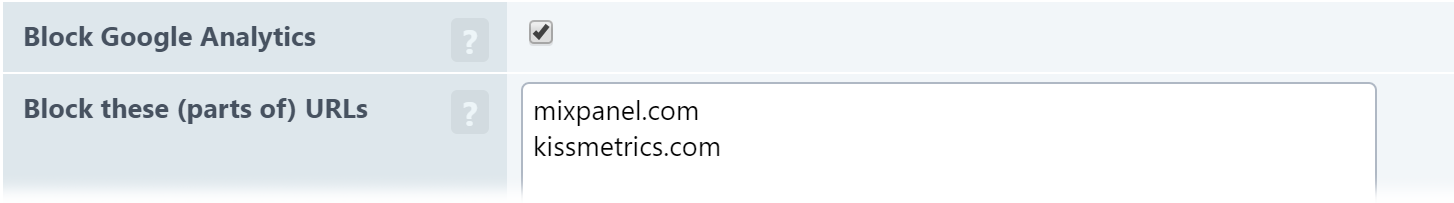
2. Block Google Analytics or specific URLs
Are certain URLs mucking up your measurement data? You can select which URLs you would like to block to minimize disruptions and get the cleanest metrics possible. Go into a monitor’s settings and hit the “Advanced” tab. This only applies to real browser monitors, since those are the only ones that trigger actual visits to your site.
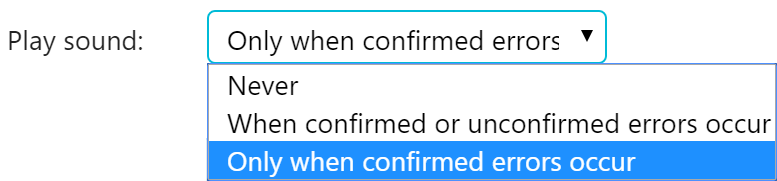
3. Enable error sounds
You’ve got your dashboard up and running in your operations room. Every aspect of your website’s performance is being monitored, but you’re busy! You can’t keep your eyes fixed on the screen every minute of the day. Fortunately, you can save your eyes (and your sanity) by enabling alert sounds in the event of an error. Problem solved! Have a look at the Monitor Status dashboard, and click on the gear icon of the tile to reveal these settings.
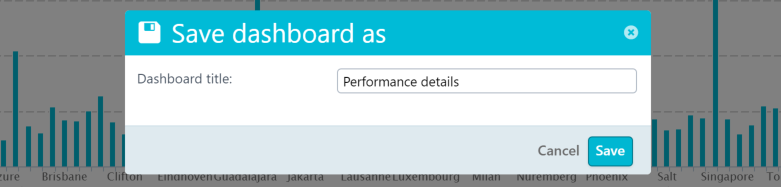
4. Save a copy of a dashboard
Have you spent hours fixing and editing the perfect dashboard? All of your hard work need not be repeated in the future! Simply hit “Save as” in the dashboard to save a copy and extend any existing dashboard in any way you’d like.
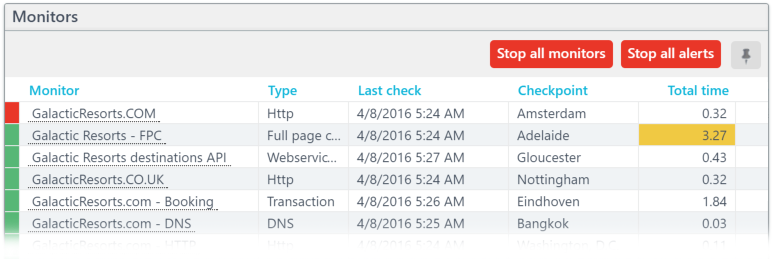
5. Stop all alerts at once
If you’re getting more alerts than you know what to do with, simply stop the onslaught of notifications by navigating to the Monitor Status dashboard and click “Stop all alerts”. This will temporarily pause all of the alerts in your account.
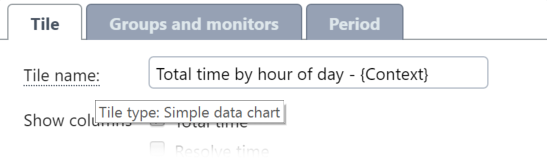
6. Reveal tile type
If you’re using one of the default dashboards, you may see an element that you wish to recreate later. To see what type of tiles are in the dashboard hover over the tile name to reveal the type.
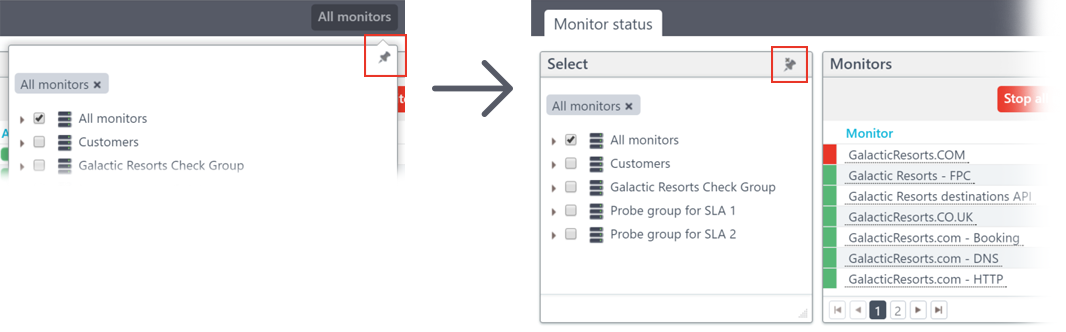
7. Pin a filter to your dashboard
Wouldn’t it be handy to have your monitor selection always in view? We’ve built an option to support that! In the Monitor Status dashboard, use the little pin icon to pin the monitor filter to your dashboard. This makes it easy to navigate through the data of your monitors.
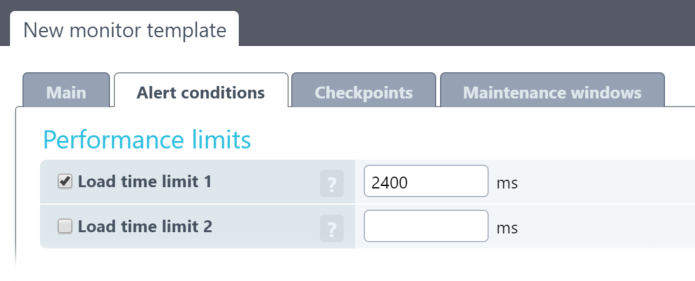
8. Apply settings to large groups of monitors
To set specific checkpoints or Alert Conditions for a large number of monitors you can use the Monitor Templates function (available in the “Monitors” menu). You can set the specific settings that you want and then apply them to a large group of monitors, saving you the hassle of having to program them individually.
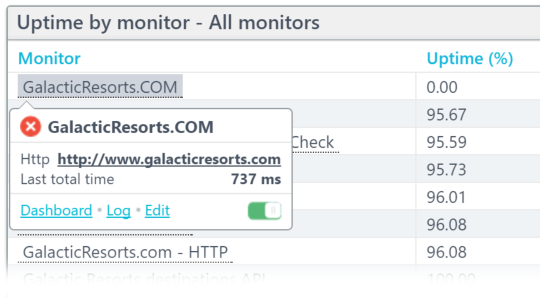
9. Use Context Tooltips
Context Tooltips give you the ability to zoom in on the fine details of a monitor. To access it, hover over a monitor’s name in any dashboard and it will show up. With this you can see the status and the last total time we measured, as well as the options to enable or disable a monitor. From here you also have easy access to the dashboard, the log, and the monitor settings so you can edit them.
10. Toggle between icon mode and list mode
Do you prefer looking at your data in a list from top to bottom, or have everything bundled more closely together with individual tiles? You can toggle between the two in any of the status dashboards by clicking on the settings icon and changing the display mode.


Leave a Reply