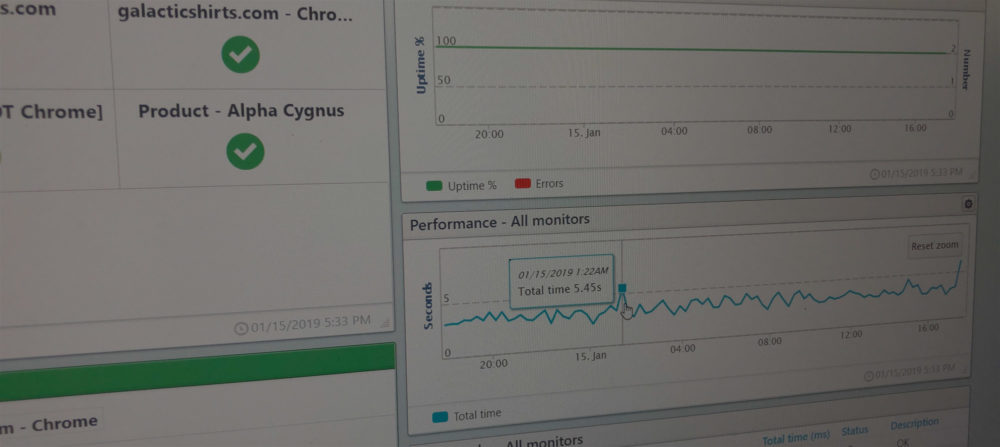
When looking at the performance of your website, web service, or API over a span of time, you will notice variations in the performance reported by the monitor. You may also notice inconsistencies between the performance reported from different monitors. Why? Why do you see spikes in your charts? Do you have an issue you need to resolve? Maybe. Sometimes these performance spikes or inconsistencies are normal and other times you can address them within your monitor settings.
In this blog post, we step you through some of the causes of variations in site or service performance as reported by your monitoring. We will talk about the steps you can take to get more consistent results and help you to understand why you see the variation.
Latency due to checkpoint selections beyond your service area
Of course, you already know that the further away from the source, the longer the load times. Discovering latency issues and fixing them is one of the reasons you want to monitor your site for performance. The first thing you want to look at when you see a spike in your performance is the test location.
Uptrends has 200 global checkpoints so that you can test as close to your users’ actual locations as possible. If you haven’t judiciously restricted your monitoring locations to only those geographic locations you serve, you will most likely see performance issues on checkpoints outside your service area.
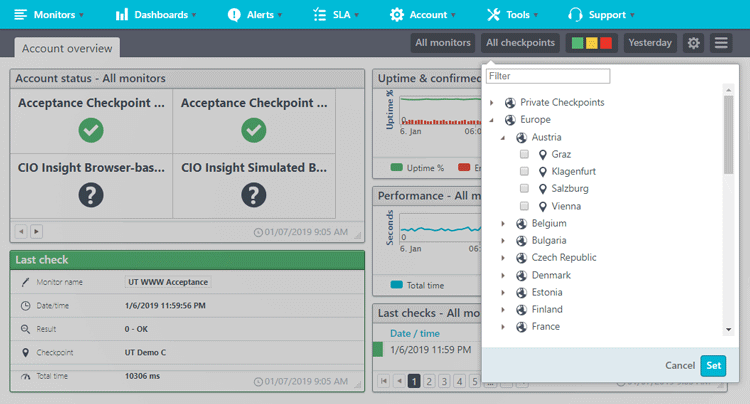
If your Uptrends plan doesn’t allow you to select individual checkpoints, you can still exclude checkpoints beyond your service area that bring down your results from your reporting. From inside your dashboard, click the Checkpoints selector on the Quick Action Menu and only select those checkpoints you care about.
Differences in Internet infrastructure
Your users and our checkpoints exist inside an Internet infrastructure based on their location. Although we locate our checkpoints in quality data centers, once a request leaves our checkpoints the speed is affected directly by the quality of the surrounding architecture. You will see slower performance from speed challenged local infrastructures. For example, your test results from Turkey, a nation with average download speeds of 4.9Mbps, will vary greatly from your testing from Singapore, a nation with average download speeds of 60.39Mbps.
Fluctuations in Network traffic
Like latency, spikes in server load is one of the things for which you want to monitor your site. If you notice significant slowdowns at peak times, it is time to beef up your site or employ a CDN to take off some of the load. If you already know you’ve got the bandwidth and power you need to deliver a performant site around the clock, external issues may affect your performance such as local infrastructure.
Geo-targeted content affects performance results
Does your site deliver different content based on location? If so, changes in content will generate changes in performance. If your company uses geo-targeting, you may want to filter your reports using the Checkpoints option in the Quick Action Menu, make custom dashboards for each region, or setup different monitors altogether.
Popups, chatbots, analytics, and surveys
Many sites and pages include popups for advertising, subscription requirements, user surveys, and chatbots. Typically, most sites have these popups on a delay. Depending on the amount of delay, these popups may show up in your performance results for your Real Browser and Full Page Check monitors based on the delay used. If the delay is inconsistent, you will see variations in performance as a result. To avoid having these popups and background running scripts from interfering with your results, you can block them with our Google Analytics and URL Blocking.
If you’re using Google Analytics, or Uptrends RUM you can easily block them in your monitor settings on the Advanced tab by checking the boxes.
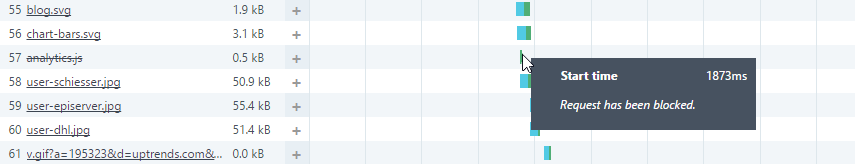
You can block other URLs by including them in the Block these (parts of) URLs field. You will still see them in your waterfall report, but they will have a line through them indicating that the monitor did not request them.
Know what performance metric is used.
Our monitors measure performance very differently based on the monitor type and what you need monitored. We recommend the Full Page Check for website performance monitoring, Transaction Monitoring for your web application, and Multi-step API Monitoring for your web service or API. All three provide performance metrics.
Full Page Check
Uptrends offers the Full Page Check for website performance monitoring. The monitor uses a real browser to retrieve and load the full contents of your page. As it requests, downloads, and renders the content, the monitor tracks key metrics on each element (even third-party elements). You can see the progression in the monitor’s waterfall chart. You also get averages for the entire page and a breakdown of the content types and their aggregated load times.
Transaction monitors
Transaction monitors give you performance information on a step-by-step basis. A transaction monitor gives you performance information on the initial page load and each round trip or step in the transaction. You can optionally get waterfall reports for each step.
Multi-step API
Multi-step API gives you performance based on the response time of each call to the server similar to a Transaction monitor. You get the total time for the test (Includes any wait times you’ve added to the monitor). In each report, you can see the time it took for each step, and you can make assertions on these times to alert you of any API calls that take longer than expected.
Other monitor types
Our other monitors (HTTP, HTTPS, DNS, email, database, and external server monitors) also give you performance information based on the initial response times. For example, Your HTTPS monitor lets you know about the response time for the first request only. The monitor doesn’t load the response into a browser, so it never collects the other page elements. A DNS monitor is only giving you information on the resolve time, and an external server monitor is giving you the time it took to connect to the server. So, when comparing results across monitor types remember the calculation may not report on the same event .
Individual monitor settings also affect performance reports
Your monitor settings can affect load times as well. So,consider your monitor settings when comparing performance across monitors of the same kind; small variations in setup can yield different results.
IPv4 and IPv6 settings
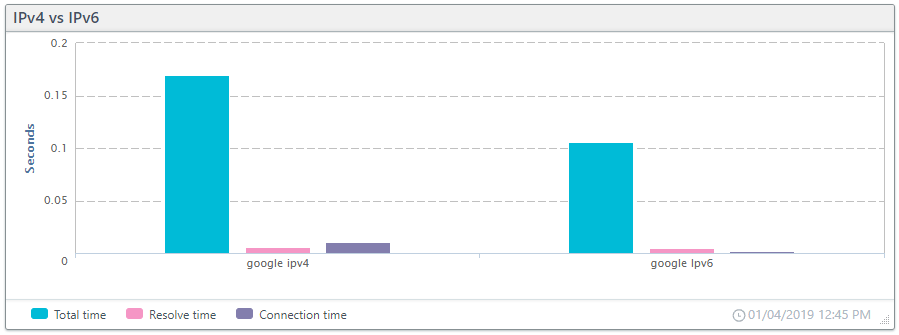
If you maintain both IPv4 and IPv6 versions of your site or service, and you notice performance differences between different monitors of the same type, check the version of the protocol used to make sure they test the same version of the site. IPv6 and IPv4 requests have very different routing paths that affect performance results. Also, with Uptrends, you have the option to use only those checkpoints that support IPv6 natively or emulated on checkpoints that only support IPv4.
The chart below shows the difference between the two versions when accessing https://www.google.com using IPv4 and IPv6.
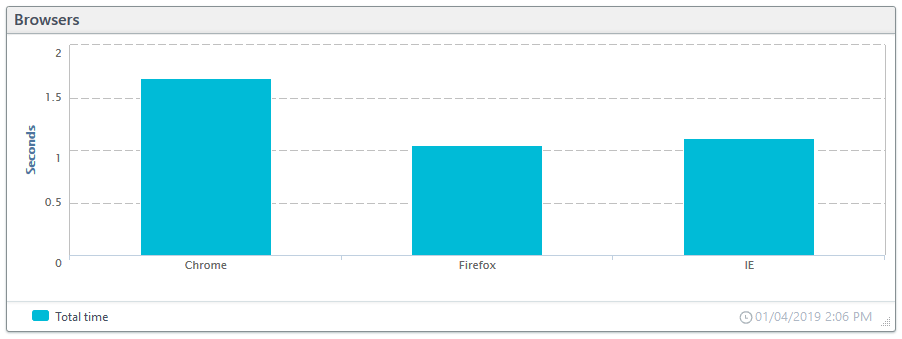
Browser type and device settings
Uptrends Monitors let you change the user agent, and in the case of our monitors that use real browsers, you can choose between Firefox, IE, Chrome, and Phantom JS. Your choice of browser and user agent will affect your performance monitoring results. In the chart below you can see how the different browsers perform when testing the Uptrends homepage.
Bandwidth throttling
Bandwidth throttling lets you test your site for slower connection speeds. Uptrends offers two types: Browser and simulated. Browser-based throttling uses the Chrome browser throttling and simulated has Uptrends manage the throttling (available for all browser selections). If you compare performance across monitors, verify if any of the monitors use bandwidth throttling and, if so, that they use the same amount and type.
Using the wrong protocol
The move to HTTPS has been going on for some time, and for the veteran Uptrends users, you may need to update your monitors. When you setup a monitor, you enter the URL. If you have changed your site from HTTP to HTTPS and haven’t updated your monitors with the new URL, your monitors show a performance hit because the request gets an additional redirect to the correct protocol and port.
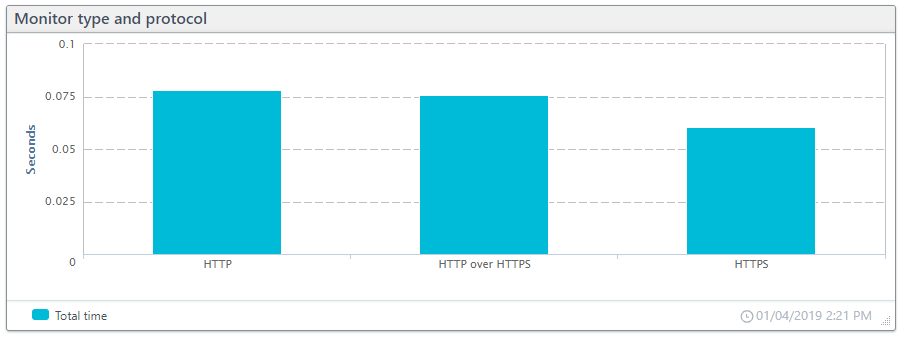
To illustrate how using the right protocol and monitor type affects your performance results we set up three monitors:
- HTTP monitor using HTTP protocol to request a site using HTTPS
- HTTPS monitor using HTTP protocol to request a site using HTTPS.
- HTTPS monitor using HTTPS protocol to request a site using HTTPS.
In the chart below you can see the impact of the redirects from HTTP to HTTPS. When exploring performance discrepancies, check that the monitor uses the correct protocol and that the URL is correct for the site.
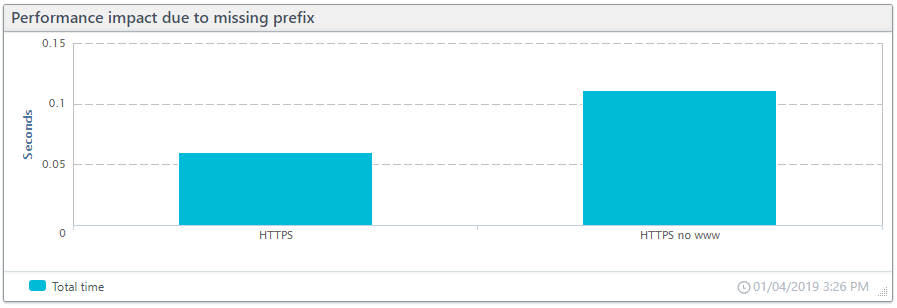
The missing “www.”
Your URL may or may not have the prefix “www” before the domain. Many brands have chosen to drop the prefix for the shorter domain name. Hopefully, whichever option your brand chose—with “www” or without—you have redirected the other to the correct domain name. When setting up your monitoring, you will want to make sure you use the correct format as well. To demonstrate our point, we set up two HTTPS monitors to test our homepage. One monitor includes the prefix, and one does not. In our testing, the redirect to the correct version doubled the total response time (see chart below).
In conclusion
Some of the above may seem like common sense to some of you, but when troubleshooting performance variances, you may find that you’ve overlooked some causes. So if you’re experiencing problems check the following:
- Was the checkpoint used within your service area?
- Does the country or region from which your testing have fast connectivity?
- Is the problem due to higher traffic on your site?
- If using geo-targeting, does the country or region receive different content?
- Are chatbots, pop-up ads, or user surveys interfering with your performance results?
- Are you comparing results from different monitor types? If so, are they measuring the same event?
- Is the IP version causing a discrepancy in results?
- Are the monitors using the same browsers, throttling, user agents, and checkpoints?
- Is the URL and monitor selection correct? I.e., are redirects affecting your results?
If you still find yourself unable to pinpoint your issues, our support heroes are at the ready. Just open a support ticket. You may also find help in our Knowledge Base.


Leave a Reply